
Prompted by a friend, I’ve been taking a look at the data for NSW school suspensions, particularly for aboriginal students. You have to get deep into the NSW Board of Education website to do this (and convert pdfs into excel spreadsheets!) but it is worth it.
In Australia, we have an over-a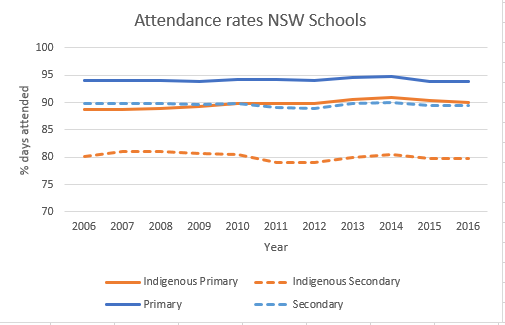 rching goal to Close the Gap between indigenous and non indigenous outcomes across a range of measures. I’ve previously posted on a few measures. This time my focus is education, specifically, attendance rates. The overarching target is to close the gap between indigenous and non indigenous attendance rates by 2018 (next year!).
The education department publishes a report annually on attendance rates in NSW government schools. It has quite a bit of info about aboriginal and non aboriginal attendance rates. Interestingly, though, mostly they are in separate tables and graphs from each other. So I’ve combined them here.
The data is pretty stable over the past 10 years, sadly, suggesting the chances of the gap being closed by next year is pretty small. I have also shown the actual gap in a graph, showing that the primary school attendance gap has improved over the last 10 years but the secondary school attendance gap has stayed stubbornly at about 10%.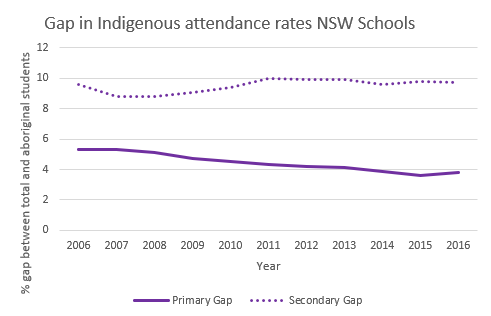
So now let’s get to the school suspensions. There are two types of suspensions measured under NSW Department of Education policy – Short suspensions (up to 4 days, generally for continued disobedience or aggressive behaviour) and Long suspensions (up to 20 days,for serious or sustained misbehaviour).
Of themselves, school suspensions necessarily reduce school attendance, because the student has been excluded from school.
So is there a difference in suspension rates between aboriginal and non aboriginal students? Yes.
In the most recent statistics available (2015), in the NSW Government school population as a whole, 3.8% of students had at least one short suspension during the school year (for an average of 3 days, with an average of 1.6 suspensions per student). For the long suspensions, 1.6% of students had at least one long suspension with an average of 1.4 suspensions per student (note that these could potentially be the same student). The long suspensions were for an average of 11 days. 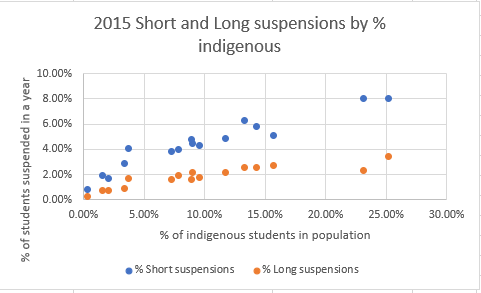 For aboriginal students, the equivalent numbers are 12.1% of students having at least one short suspension, and 5.9% of students having at least one long suspension. So despite making up 7% of the student population, aboriginal students made up about a quarter of the suspended student population.
The graph shows an analysis for each Family and Community Services district (which is the most granular the data is available). I’ve plotted long and short suspensions against the % of indigenous students. The correlation isn’t perfect, but it is clearly there, particularly for the short suspensions, where the numbers are larger. As a contrast, I also plotted the suspension data by the proportion of the population speaking a language other than english at home. Overall for the NSW school population, that’s 34% of them. But there doesn’t seem to be much correlation with the non english speaking students and the proportion of suspensions.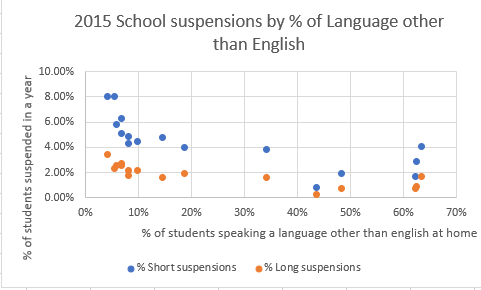
So why am I worrying about suspension data when we are talking about how to close the gap in aboriginal school attendance? First of all because suspension itself reduces school attendance. Those students who had long suspensions on average had 1.4 of them. At an average of 11 days per long suspension, that’s 15 days of school lost (nearly 8% of the school year). Second, because the educational outcomes are likely to be much worse for a student who is suspended, perhaps repeatedly. It makes for worse learning to miss school at any time. Harder still if the missing school is associated with a whole bunch of behavioural issues that are likely to make learning harder. It seems likely that a student who is on the edge of suspension, or was suspended recently, is also more likely to skip school without being suspended.
And then there is evidence that there is a well worn path from school suspensions to the juvenile justice system to much worse life outcomes. The 2010 Strategic review of the NSW Juvenile Justice system noted that suspension from school is a risk factor likely to lead to more contact with the justice system, and potentially convictions.
The key risk factors are those associated with school attendance/behaviour and past contact with the criminal justice system. Not being at school, having been suspended or expelled from school and having had several prior contacts with the criminal justice system all independently increase the likelihood of another conviction.
So over representation of aboriginal children in school suspensions is likely to lead to over-representation in the justice system. And we definitely have over-representation of aboriginal people in the Australian justice system, particularly the prison population.
But which comes first? Are the aboriginal children just more likely to misbehave, and the school system is just reacting to their misbehaviour? Or is the school system reacting differently to behaviour from aboriginal and non aboriginal children in a way which increases their chance of suspension?
It is impossible to tell from the statistics I have presented here. But there I do have a strong suspicion that there is at least some discrimination involved – randomised trials do tend to show discrimination exists in surprising places (such as this study which shows it in responses for requests for information about opening hours).
It is worth analysing much more granular data, trying to match individual school systems and even schools with similar characteristics of their students. That would help the educational system understand the schools that were doing well at keeping their students engaged, even with challenging behaviour, and those which seemed to be giving up on aboriginal students. It would be particularly worth investigating which schools were keeping their aboriginal children more engaged with the education system, to assist their likelihood of better educational outcomes, and how they were doing it, so that others could replicate it, and improve the system as a whole.
Congratultions Jennifer. This sort of analysis seems analogous to the sort of work tha Taylor Fry does for the NZ Govt to assess where govt spendig should be targeted to reduce welfae or toher govt outlays in te future.
It is the sortof work the profession should be doing more of
Good article Jennifer. A sadly intractible problem but an excellent suggestion at the end of your thoughts. Cheers. Lx