
Ten years ago, after the Victorian bushfires (which were the worst ever loss of life in bushfires in Australia) I wrote about climate change causing much more frequent weather extremes. Those bushfires burnt 450,000 hectares, mostly over two terrifying days in February 2009. So far this season, we have seen at least ten times that much burnt land in Australia,with the recent few days being particularly terrifying over much of the eastern coast.
Much has been written about the bushfires. Rather than rehashing it all, I wanted to remind my readers about the effect of climate change on extremes, and how it is not necessarily intuitive. Last week Australia had its hottest ever day two days in a row (narrowly missing three days in a row, because the third day was only the second hottest ever recorded). Australians, at least, are coming to understand that climate change creates bigger change at the extremes than it does at the average.
My favourite climate scientist, Michael Mann, tweeted a simple explanation:
For those looking for a statistical explanation: https://t.co/rxmOnzni63 pic.twitter.com/UgoSz6kXot
— Michael E. Mann (@MichaelEMann) December 19, 2019
Fundamentally, if the distribution shifts even a little bit to be hotter/wetter/drier/windier, then even without changing the likelihood of extremes, the very rare extremes we were used to become much more likely. So put it in temperature terms – say the summer mean maximum temperature in central Sydney is 25 degrees, with a 1 in 400 chance of a 40 degree day (0.25%). Increase the mean maximum temperature to 26 degrees, and there is a 1 in 200 chance of a 40 degree day. That 40 degree day has just become twice as likely. Given we have already had about 1 degree of warming in Australia, we are seeing at least that change this summer.
Actuaries’ training is about extremes of distributions; much of our training is about how to price for, and hold enough capital for, extreme events. So the Actuaries Institute has developed a climate index.
…an objective measure of extreme weather conditions and changes to sea levels, to help policymakers and Australia’s businesses assess how the frequency of weather extremes is changing over time.
The components of the index were chosen due to their link to risk, an area of expertise for actuaries, and because extremes have the greatest potential impact on people and, often, the largest cost to the economy.
The index is the culmination of an extensive research and implementation process. It is the result of consultation with Australia’s Bureau of Meteorology, Commonwealth Scientific and Industrial Research Organisation (CSIRO), leading insurance and natural hazard scientists and regulators
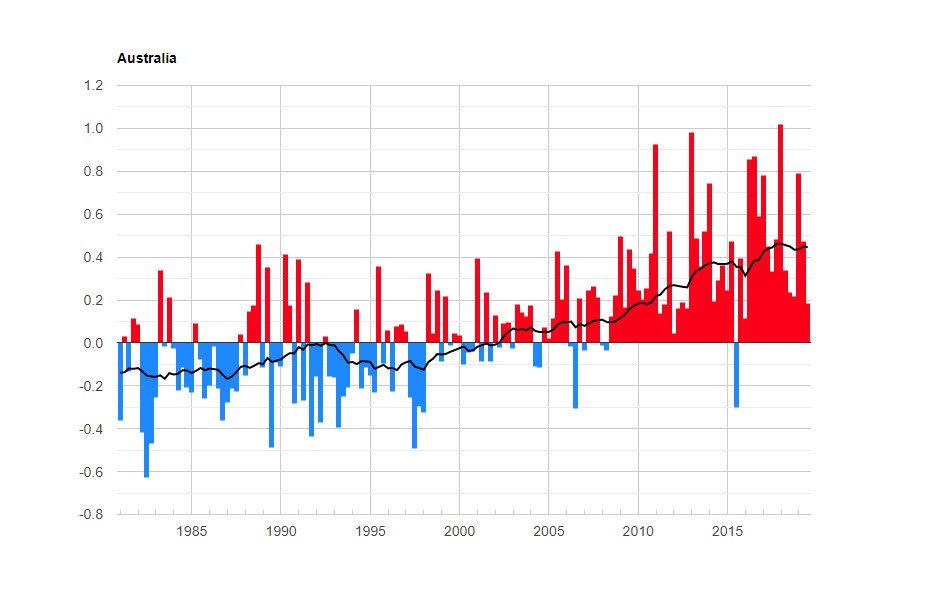
The index shows extremes for 12 different Australian regions, and six different climate measures (warm and cold temperature, extreme wind, extreme rainfall, sea level and drought). It measures the quarterly frequency of each measure being above the 99th percentile of the reference period (1981 to 2010).
And it’s pretty clear that the extremes are increasing. The graph below shows the whole index (which combines sea levels, temperature, and rainfall into a single index).
 According to the Actuaries Institute:
The index indicates increases relative to the reference period in the extremes of temperature and in the extremes of sea level. As such we expect that risks that are linked to higher temperatures and higher sea levels have increased. The wind level extremes appear broadly unchanged overall. Over the last 20 years Australia has experienced two phases of drought and this is evident in the drought and rainfall metrics which show periods of high and low.
Ten years ago, the fact that struck me was that the flash point of eucalyptus oil is 49 degrees. Bushfire risk does not just increase in a linear way with temperature, and the temperature itself does not increase linearly. The closer the air temperature gets to 49 degrees, the more likely that just some random spark will set something off. And this week, with stories from everywhere of bushfires appearing without warning have confirmed that we cannot rely on linearity, in thinking about what is going to happen with climate change.
And its not just bushfires themselves, there are many more risks that come with heat and weather extremes:
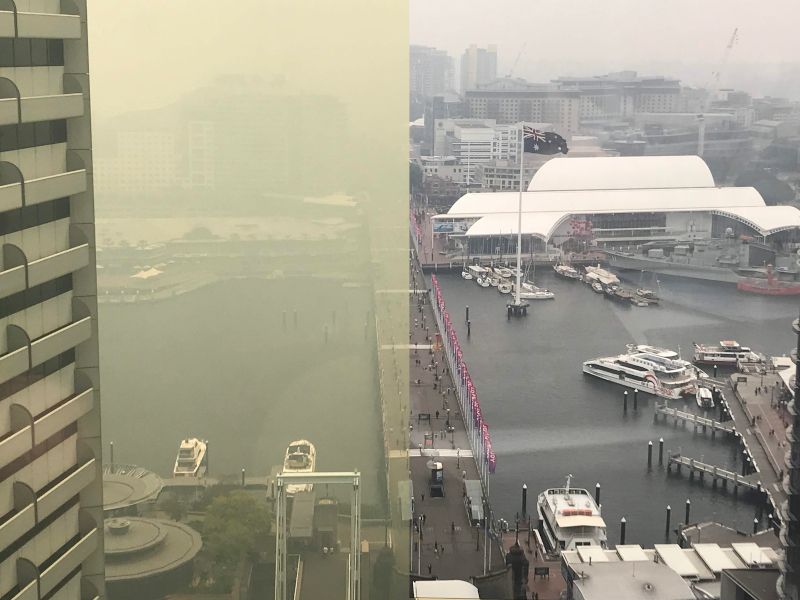
A wetbulb temperature of more than 35 degrees celsius is enough to kill you (46 degrees celsius with 50% humidity). Powerful rainstorms and hailstorms are happening simultaneously with the bushfires in Australia (sadly not in exactly the same spot). Too much water overwhelms infrastructure set up for the extremes of weather we are used to. And of course, the bushfires themselves create dangerous air pollution, and much more of it on many more days.
I’ve been blogging about climate change for so long (since 2005) that the category I have for it used to be called Global Warming. And we feel further away from taking it seriously in Australia than we were after the Victorian fires in 2009. But increasingly, as the insurance industry prices for the increased risk, we as a community are going to have to take mitigation much more seriously. And I suspect I’ll be posting about climate change, cost and mitigation, here more often.
Thanks, Jennifer,
Michael Mann’s diagram – and your further explanation- is very helpful in understanding the impact of a small change on the extremes.
Agree nice little article Jennifer
A point I try to make whenever I discuss climate change with folk . Simple graph says it all 🙂