
Total death rates in Australia up until the end of May are lower than recent averages. But there was a peak of deaths in late March and early April, which seems to have been a bigger peak than the reported Covid19 deaths (which peaked in the same weeks). In my view we can draw two conclusions:
- More people probably died from Covid19 during the first wave of cases than was reported at the time.
- Overall, the lockdowns have probably saved more lives than just the reduction in Covid19 cases.
The ABS has just released their preliminary report on deaths in Australia up to the end of May 2020. I’ve graphed the information below. It’s a very busy graph, but the two lines to focus on are the orange line, showing the average deaths each week in the last five years (after adjusting them for the current size of the population and the age structure) and the two blue lines – dark and dotted, which show the reported deaths to date in 2020 for each week (with the dotted showing the likely extra deaths which have not made it through the reporting process as yet).
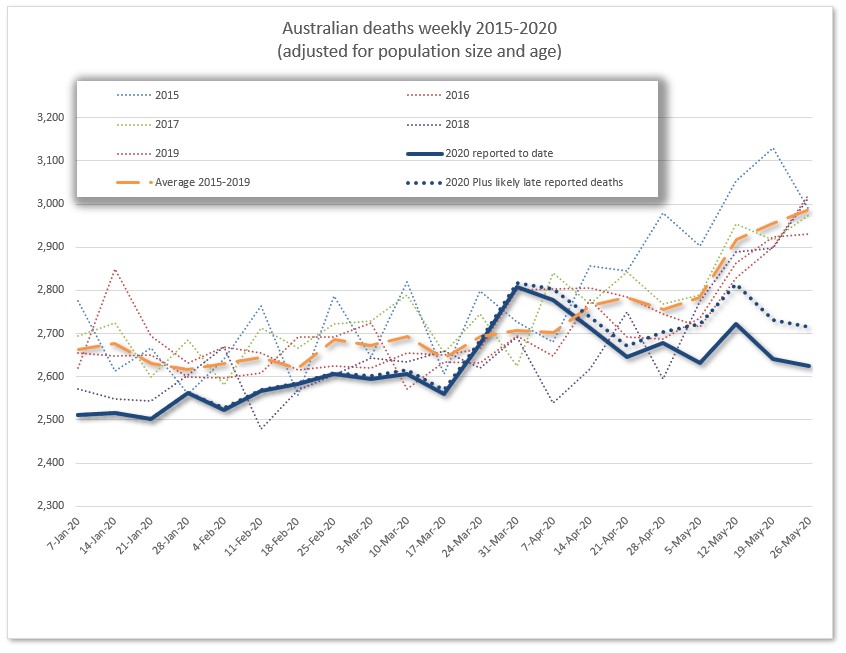
Overall this analysis shows that up to the end of May 2020, Australia has had fewer total deaths than we would have expected based on recent history. But there was a peak period in late March and early April, where deaths were higher than the average recent history for those months (up to 200 total extra deaths than average in those two weeks), and those two weeks coincided with the first peak of deaths from Covid19 in Australia. But officially, there were 40 deaths from Covid19 reported in those two weeks, not 100-200. So what conclusions can we draw? First, the difference is small. In contrast with Spain and the UK (where total extra deaths were 20% higher than average in the peak period), the extra was around 3%. It could be random fluctuation (although the timing is suggestive). But if there is a cause beyond randomness, commentators suggest three main reasons for excess deaths from any pandemic being higher than those officially reported:
- Official statistics might exclude those who did not test positive or were otherwise identified before dying of the disease, which is particularly likely when testing is not fully ramped up
- There may be lags in the official data of those who have died from Covid19
- Perhaps the pandemic, or public health measures to deal with the pandemic has indirectly caused other deaths, because people are unable or unwilling to visit hospital for other illnesses.
So which is it for Australia? My own view, from looking at the pattern of subsequent mortality data, is that there were probably more deaths from Covid19 in Australia in late March and early April than were officially reported.
Why? If the extra deaths in those two weeks were indirectly caused by public health measures such as lockdowns causing increased deaths, deaths would have continued to be above average during late April and May. Lockdowns in the two most populous states were not lifted until mid May, and deaths had substantially fallen to below long term averages by then. And with the two major Covid19 affected states, NSW and Victoria, reporting daily on deaths from Covid19, it seems unlikely that an identified Covid19 death would have been reported late to the registrar.
Back in March and April, Covid19 testing in Australia was much less widespread than it is now. Daily tests across Australia as a whole were hovering around 10,000 (compared with around 60,000 in recent weeks), with a around 1-2% of them being positive (around 0.3% this week across Australia). It is highly plausible that some people who died back in March and April died from Covid19, but were not identified as such.
Why could deaths be reduced overall since that small peak? A few reasons that I haven’t explored in detail include
- motor vehicle accidents – the average of deaths in the four months from April to July is 50 fewer deaths than last year
- flu and other infectious diseases – according to a tweet today (see below), the flu deaths to date in Australia this year are over 400 lower than this time last year and none have occurred since April. Pneumonia admissions to hospital (in NSW at least) are also well down on normal.
- deferred medical procedures (which might not be long term good news) – given how much elective surgery has been cancelled this year, sadly some people are injured and die from elective surgery, even though on balance elective surgery is good for long term health
- And mortality has continued to improve in Australia over recent years.
There are also like to be increases in deaths now and in the future caused by people delaying seeking of medical attention. In the short term, these seem to be more than balanced by the lives saved. It is too early to tell whether the long term outcomes might be different.
Australia hasn’t recorded a single flu-related death since April.
In the year to date, there have been 21,005 confirmed flu cases and 36 deaths. More than 20,000 of these were recorded pre-covid. This compares to 214,377 cases and 486 deaths this time last year. Astounding.
— Chelsea Hetherington (@chelsea_hetho) August 23, 2020
Link
With this week’s news that Australia’s federal government has signed a letter of intent to buy a vaccine from Astra Zeneca, a couple of links on vaccines and vaccine related policy.
First, a profile of the scientist, Sarah Gilbert, leading the development of the front running vaccine, at Oxford University:
Gilbert has been all over the British press, but she appears to regard public attention as a distraction. For more than two decades she worked anonymously, developing vaccines while also, of necessity, churning out endless grant applications. Her research was rarely discussed outside scientific circles. Now she’s leading one of the most high-profile and advanced vaccine candidates against Covid-19, with Phase III, or final-stage, trials under way involving thousands of people in Brazil, South Africa, the U.K., and, soon, the U.S. Money is no longer a struggle.
Reading this profile reminded me once again of the value for society of investing in science – even when the payoff isn’t obvious.
And this article talks about the supply chain of any vaccine, and how it isn’t as simple as just buying some doses from someone, there are some quite obscure ingredients required, as well as the more obvious things like glassware.
Vaccine supply chains contain some unusual links, including horseshoe crab blood, shark liver oil and an enzyme that’s one of the world’s most expensive products. Other links rely on novel manufacturing processes that have not yet been implemented at scale. Each link in the chain needs to be stress-tested and strengthened. For the potential weak spots, alternative manufacturing processes need to be considered and prepared.
Life Glimpses
Regular readers will know I have quite a lot of family in New Zealand, some of whom are back in Stage 3 lockdown. One of my cousins (who is only in stage 2) has taken to sharing a picture each day of one of the collection of life size cow sculptures in her town while the lockdown lasts. It’s a lovely addition to my daily emails, plus I get the occasional glimpses of other slices of life from various other cousins also included in the email.
But it does remind me how many of the people I care about around the world, as well as here in Australia, are feeling more isolated and nervous again, as cases creep back up and restrictions on movement and activities are increased. Even though my life here in Sydney is not very different from what it would be in a stage 4 lockdown if I was in Melbourne, the knowledge that I can go out, for a long bushwalk for example, makes a difference.
Bit of Beauty
Today’s bit of beauty comes from a glorious sunset a few days ago. I have a bit of a backlog of beautiful pictures at the moment, so I may need to start blogging more frequently…

Thanks Jennifer, very interesting. One other point that supports your theory that more people died from COVID but were undiagnosed is that the testing criteria was very strict in March/early April. You could only get a test if you had been overseas or had been in contact with an existing case.
Great chart, Jennifer.
Interestingly, deaths from motor vehicle accidents and deaths during elective surgery will generally be reported to the coroner and therefore not included in these statistics, which are just doctor certified deaths.
From https://www.bitre.gov.au/publications/ongoing/road_deaths_australia_monthly_bulletins, there were 344 MVA deaths in Australia between the end of March and the end of July, compared with an average of 396 for the same period across 2015-19. That’s a reduction of 13%. And these numbers are not adjusted for population increases.
(In particular, MVA deaths in April were 20% below average and May was 15% down. As it happens, January was also 15% down, presumably thanks to reduced road travel due to bushfires.)
So it seems likely that your chart understates the reduction in deaths this year.
Dies this mean that deaths from suicide and domestic violence would also be excluded from this chart as they are usually referred to a coroner? There is a lot of speculation that deaths from these sources have increased, but I have not seen any figures. Are there any reliable sources?
In relation to the spike in deaths in late March/early April, I note that there were spikes in pneumonia/flu deaths and in diabetes deaths at that time. These are not enough to explain the total spike, but they do support a view that there were several unreported COVID-19 deaths.