
 I’m a bit behind here, but APRA released their quarterly life insurance statistics this month. I’ve done a quick graph of the rolling 12 months profits since APRA first started releasing these statistics.
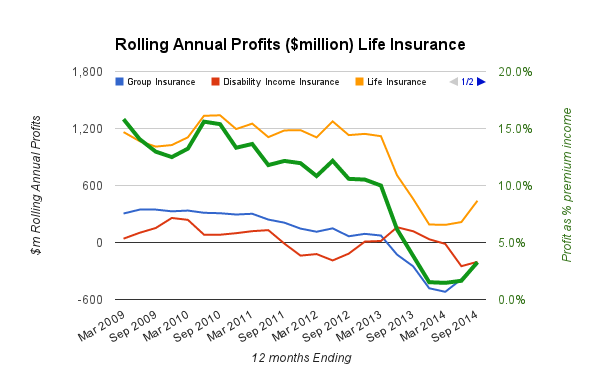
Note that Group Insurance and Disability Income Insurance are different subsets of the total – the subset (that I haven’t shown) where the industry is making money is retail lump sum insurance.
The graph shows that the rolling 12 months profit for the total life insurance industry has gone up for the first time since the end of 2012.
But the striking part of this graph remains the green line – the profits that the industry as a whole has made as a percentage of premiums. In the 12 months to September 2014, that number has crept back up to 3.3%.
That’s unlikely to be anywhere near enough to provide an adequate return on capital for the shareholders in the industry.
Thanks, yes, revealing, but no surprise. And whilst it (life insurance) continues to be an unattractive business for shareholders, it may well be be a hard business to work in. Actuaries have always been expensive and it isn’t obvious that we are well equipped (simply by being actuaries) to help reengineer these businesses back to viability. It doesn’t look to me as if the ‘big answers’ are likely to be revealed by ever more complex (and expensive) stochastic modelling. But great opportunities for those equipped for ‘creative destruction’ …. and who are robust enough to take some bruising along the way.
Looking at the APRA life stats what would be the impact on profits if commission payments (about$3 billion) were taken out of the equation. I understand life insurer profits would rise but I don’t know by how much. If upfront and trails were removed, there would still need be some form of renumeration but possibly a lot less than current standards.
Interesting question – I haven’t done the modelling, but maybe some of my readers can answer.