
Today’s Insight
In my first Covid reflections, I mentioned the difference in timing between infection, being infectious, having symptoms, testing positive, and recovery, or serious illness and/or death. I said that a positive test captures an event (the infection with Covid19) that happened between 4 days and 2 weeks before the positive test. I thought it might be worth exploring how this works a little more today, inspired by this article on Medium. According to Our world in data,
The WHO writes “people with COVID-19 generally develop signs and symptoms, including mild respiratory symptoms and fever, on an average of 5-6 days after infection.”31
While the mean incubation period is 5 to 6 days, the WHO adds that the incubation period can vary in a wide range of between 1 to 14 days.32
From the Australian government the time of actual infectiousness is around 24 hours before symptoms.
It’s still being investigated, but evidence suggests that a person can spread COVID-19 infection from about 1 day before they first develop symptoms, until up to 1 day after the symptoms stop.
From Our world in Data again, the timeline for the actual disease is also quite variable:
On average the disease lasts two weeks. The WHO reports that “the median time from onset to clinical recovery for mild cases is approximately 2 weeks.”33
Again this is based on the 55,924 confirmed cases in China
For severe and critical cases it is 3 to 6 weeks according to the same study.
Different countries have wildly different testing regimes, so the point in the infection that a person is tested will also be quite variable. Let’s take Australia as an example. The current guidelines (24 March) on the Australian government health website are:
You will only be tested if your doctor decides you meet the criteria:
- You have returned from overseas in the past 14 days and you develop respiratory illness with or without fever
- You have been in close contact with a confirmed COVID-19 case in the past 14 days and you develop respiratory illness with or without fever
- You have severe community-acquired pneumonia and there is no clear cause
- You are a healthcare worker who works directly with patients and you have a respiratory illness and a fever
There is a global shortage of the test kits that pathologists use to diagnose COVID-19. This is why we are doing targeted testing instead of widespread testing.
The diagram below shows a subset of the total timeline from onset of symptoms to intensive care admission. Based on the Australian government’s criteria above, the earliest you will be tested will be at the onset of symptoms. If you have contact with a known case, it will hopefully be in the first week of those symptoms. If you have not had contact with a known case (which is now increasingly the case), you will be tested most likely on hospital admission or shortly afterwards. So based on the timelines from WHO’s China study, that is likely to be at the earliest 24 hours after you became infectious, but most likely a week or two after you became infectious.

That means that all the case numbers we are seeing in Australia right now are at least a week out of date. You can see this effect more clearly in the graph of what happened in Hubei – below – the timeline of actual cases and the cases that the authorities were counting. It took 12 days in Hubei for the official count to catch up to what was actually happening.
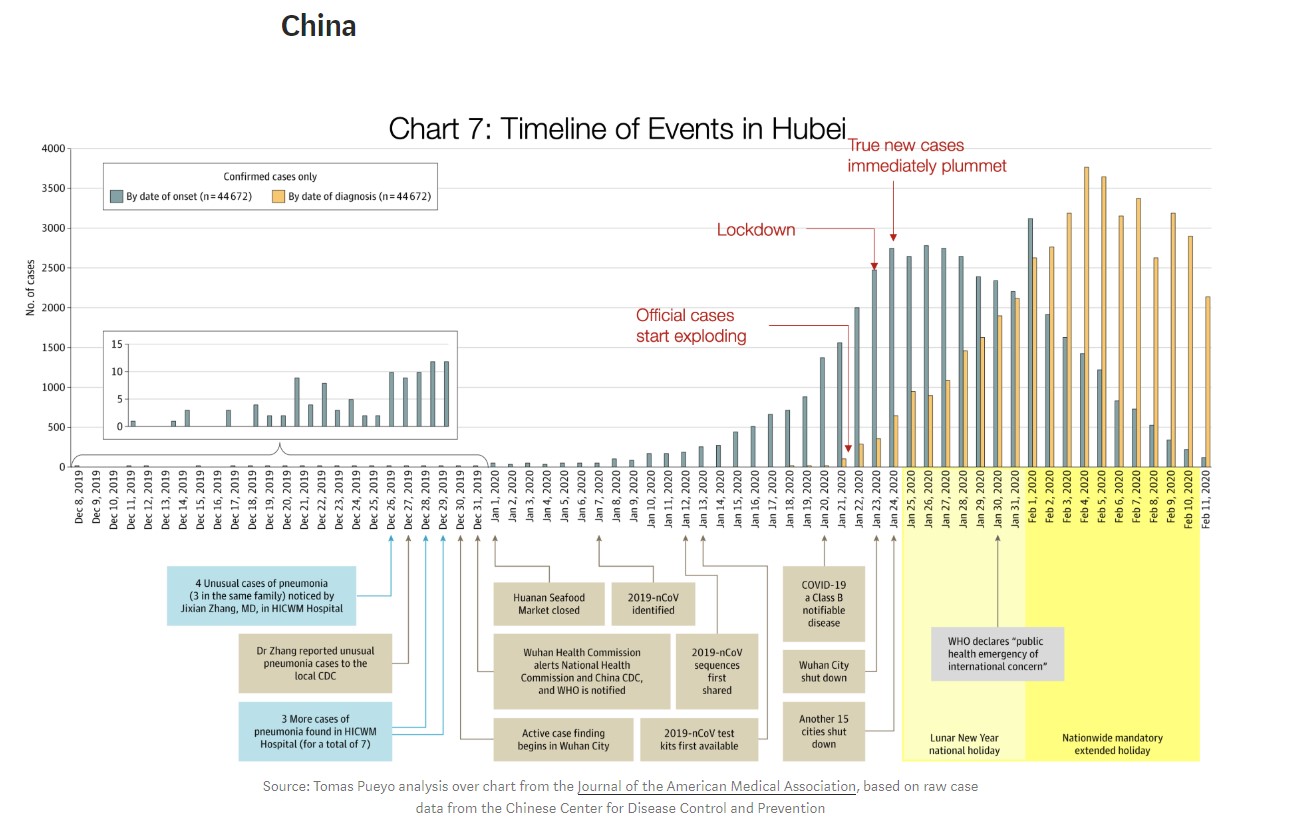
.
What does this mean? It means that the measures that we are taking right now (closing cafes and restaurants etc) will be having an effect immediately, but won’t show up in any statistics for at least a week, perhaps more. This is why so many epidemiologists have been pushing so hard for these measures, as their experience helps them “see into the future” – by understanding that what information we have right now is unavoidably out of date.
So when cases in Australia continue to go up in the next week, it is important to hold our nerve and remember that it will take time to see the effects of all the things we are doing today to slow the spread.
Best Links
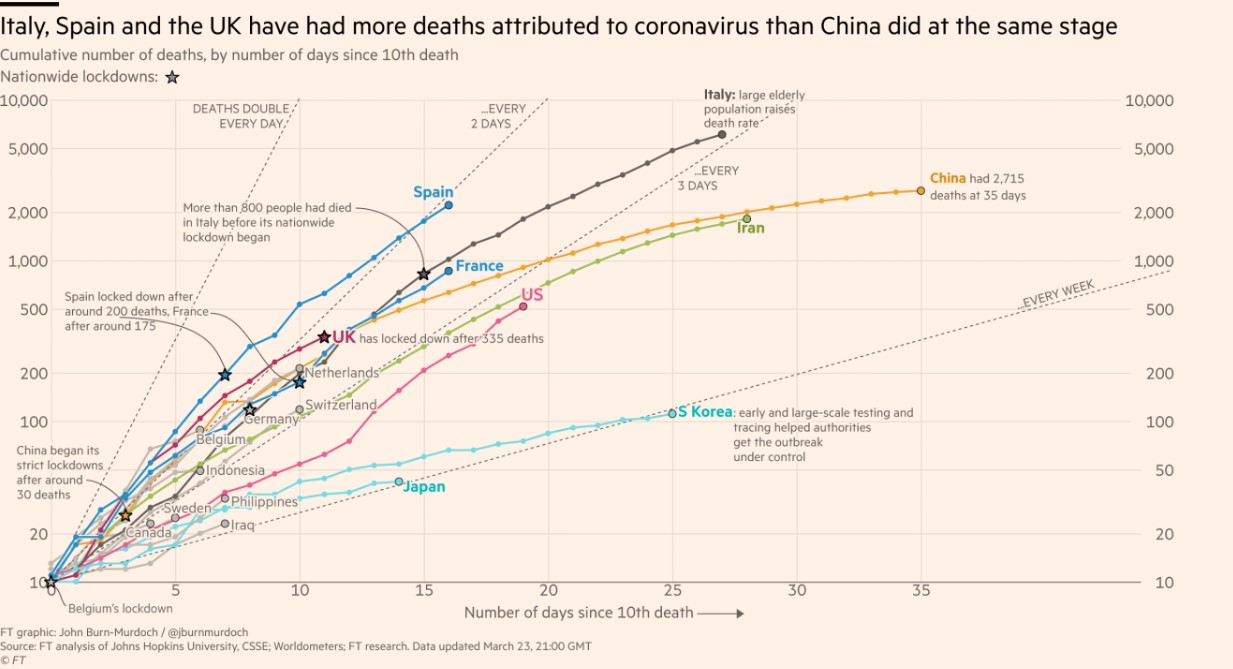
The Financial Times has ungated its Coronavirus coverage. You’ve probably seen this graph before, I’ve seen it quite often on social media (and versions from other data journalists), but the rest of the data journalism in this link is well worth reading and understanding. I do hope it is a long time before Australia makes it to this graph – it starts at 10 deaths.
Life glimpses
- Our local high school had about 80% students absent today. It would probably have been more, but today was the last day for the Year 12 half year exam period.
- When I walked past my local cafe this morning (which is normally buzzing all morning even on a weekday) there were about 15 people waiting very responsibly distant from each other waiting for their takeaway coffees.
Bit of Beauty
More flowers from the neighbourhood today, enjoy the colour.

Thanks, interesting as ever.
Here’s a report on Covid patients in UK intensive care which could be of interest: https://www.icnarc.org/DataServices/Attachments/Download/a9875849-f16c-ea11-9124-00505601089b
And the situation in Japan: https://www.japantimes.co.jp/opinion/2020/03/21/commentary/japan-commentary/japan-still-coronavirus-outlier/#.XnmeMYzZWf1
Thanks, very interesting. Really appreciate your blog and insights.
Keep Writing, Keep walking and keep sending such beautiful flowers!
Love Marta
Thanks. It’s great to have you dustill these points. Much appreciated.
Jennifer
Thank you for the updates which are very interesting and I appreciate the beauty. I am trying to keep some of the team at the Institute motivated to keep up our yoga and others are ensuring some positive moments for us all. Congratulations on your board appointment with Pac Life Re and all the best to you and your family. May your wish for Australia to stay off that graph for a long time be granted!