
Today’s link
I’ve talked a lot about levels of testing on this blog. Australia continues to test for Covid19 at a higher level than many countries around the world. And the proportion of tests that are positive continues to hover around the 2% level in Australia, which is a reassuringly low level.
Nate Silver at fivethirtyeight has built a model showing how the level of testing in any particular country can give very different pictures of the growth rate of Covid19 cases in a country. For my statistical readers, at the end of the article you can download his spreadsheet and play with it. I did that, and despite my finding his parameters very sensible, I was unable to replicate what is happening in Australia from a quick play with the spreadsheet. Hopefully some of my readers (who gave me suggestions for working out the underlying rate of infection from the percentage of tests that are positive) might have some ideas. But I’ll quote a few of his conclusions to give you the flavour.
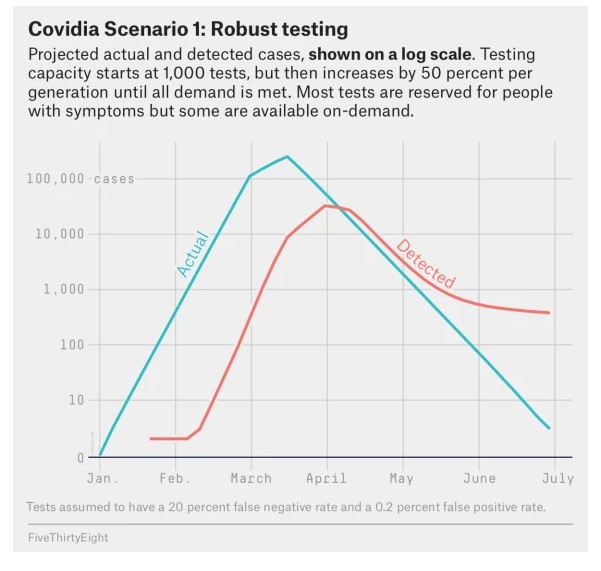
There are quite a few things to look at here. The most obvious and probably the most important one is simply that a 15-day delay between when someone gets infected and when their case shows up in the data as a positive test makes a huge difference. Even if everything else was going perfectly — 100 percent of the population was being tested and the tests are 100 percent accurate — with an R of 2.6, a 15-day delay would result in there being about 18 times more newly infected people in the population than the number of newly reported positive tests at any given time…
…Next, even with relatively good testing, you’re still likely to miss many cases. By the end of the scenario on June 29, 1.2 million people have been infected at some point in Covidia, but there are only 186,000 detected cases, for a detection rate of about 16 percent (and some of those are false positives so the actual situation is a bit worse than that)…
…There’s also a third issue: If testing is increasing, the rate of growth of a disease can be overestimated. Alternatively, if testing is stagnant or decreasing, the rate of growth can be underestimated…In other words, the rapid rates of growth in new cases you can see in a country (say, Germany) when it first gets serious about testing are both a function of the number of tests increasing and the number of infections increasing — and it’s hard to tell what’s what.
Do go and read the whole thing. I warn you though, it has made me more cautious about the “good news” I’m increasingly reading about the growth rate of cases in Australia. Is it because we are testing more? Are we testing the right people? While over the last week, the average daily growth rate of cases dropped from 19% a week ago to 6% yesterday, several of the 538 models show that result with an underlying increase in cases. Although in Victoria they are testing everyone who asks for a test this weekend, according to this report. I hope that is also happening in NSW.
A Victorian nurse has informed me that the Vic department of health have advised them to test all patients presenting with symptoms from today until Monday. Irrespective of contact or O/S travel. #Covid_19australia #COVID19Aus @COVID_Australia
— Caroline Atkinson (@caro_j_atkinson) April 4, 2020
Life Glimpses
All the way through this I feel as if I have been a day or two ahead of the zeitgeist (not much more, I don’t give myself that much credit). And today, I found the lack of social distancing out on the pavements quite frustrating. It was a beautiful day again in Sydney and lots of people were out for a walk. And most of them made an effort as we passed each other to stay away. But there are still the occasional people walking obliviously down the centre of the footpath. I’m sure the risk is low, but it isn’t zero. The forty or so confirmed cases in my local council area are probably still the tip of the iceberg of actual cases.
Bit of Beauty
We’ve had a lovely sequence of days in Sydney this week – often with rain overnight and then a beautiful day. Hence the mushrooms are growing all over the place. This photo courtesy of geekinsydney.

Reflections No.15, I will skip it, I do not how to play with spreadsheets. As to life glimpses,
Watching the people as they go by, quite a few do not observe the required distance. Dog owners
do, but I think it is more to prevent misunderstanding between the pets. The mushroom looks
like an umbrella on a tropical beach great. Thank you geekinsydney. Love Marta
Hi Jennifer
Thank you for your informative blog – part of my regular reading. I’ve been keeping my own spreadsheet to track daily cases by state. It feels like the pandemic has been going on for a very long time, so it is interesting to note that 4 Sundays ago on 8 March there were 80 cases in all of Australia. Exponential growth is certainly a scary thing when it is not working in your favour! I am hopeful of the current plateauing, and notice this morning that there will be more widespread tests conducted in local government areas with higher transmission of unknown origin.
My family has been rigorously observing social distancing. Thank goodness that the internet has become so ubiquitous and advanced (in spite of NBN strategy stuffups) – the girls are fully online at uni, which means they don’t have to leave their rooms (and sometimes their beds) other than mealtimes and using the gym equipment, teenage heaven. My workplace has moved fully online rapidly and smoothly. We are using Microsoft Teams, which seems to work better than Zoom (which I use to keep in touch with overseas family).
I suspect you’d have to exclude overseas acquired infections to get anything useful about the Australia epidemic. But then the numbers get (thankfully) small that individual situations outweigh any statistical model.
While NSW had 4 cases in January, the last of those was discharged on Feb 13th and we didn’t get new confirmed cases until 1st March (a traveller from Iran). But with the first fatality being on March 4th, setting March 1st as ‘generation 0’ date seems reasonable. I’d guess at 4 initial infections in generation 0, but really the model would need to accommodate additional fresh infections from outside the population in each generation.
First stage of the lockdown was March 15th. Generation 3 seems appropriate for ‘intermediate measures’ and generation 4 or 5 for lockdown.
Thanks Gary, very good points on the start date, that hadn’t occurred to me that the initial cases hadn’t really gone anywhere.
The international seeding did occur to me – just need to hope that the reproduction rate for the Ruby Princess is under 1.