
In the USA, cases are increasing again, but deaths from COVID19 are still falling from the April peak. The US is now identifying more mild cases, but the recent increase in cases is almost certain to lead to more deaths per day in a the next few weeks.
It’s been a while since I blogged about Covid19 outside Australia, and the US outbreak is increasingly in the news. So I thought I’d take a quick look at the outbreak there. The NY Times is the place I look for statistics state by state. As of June 20, there are now more than 2.2 million identified cases and nearly 120,000 identified deaths from Covid19.
The question I’m looking at is why are cases increasing, but deaths still falling? There’s a few possible explanations for this:
- There is increased testing, so more mild cases are being found – this is clearly happening to some extent
- The deaths just haven’t happened yet, as people are only just being infected with the virus – this is also somewhat true – deaths lag identified cases by 2-3 weeks
- The hospitals aren’t as overwhelmed as they were in New York in March so the actual risk of death from severe cases has fallen – this effect is too subtle to test so far, but I’ll keep watching
- Deaths from Covid19 are still happening, but are less likely to be recorded as Covid19 – there isn’t much evidence of change in recording, but this information takes a month or so to come through in the US.
First, let’s look at the data for cases and deaths. This graph below shows the weekly rolling average cases and deaths in the USA since the beginning of February.
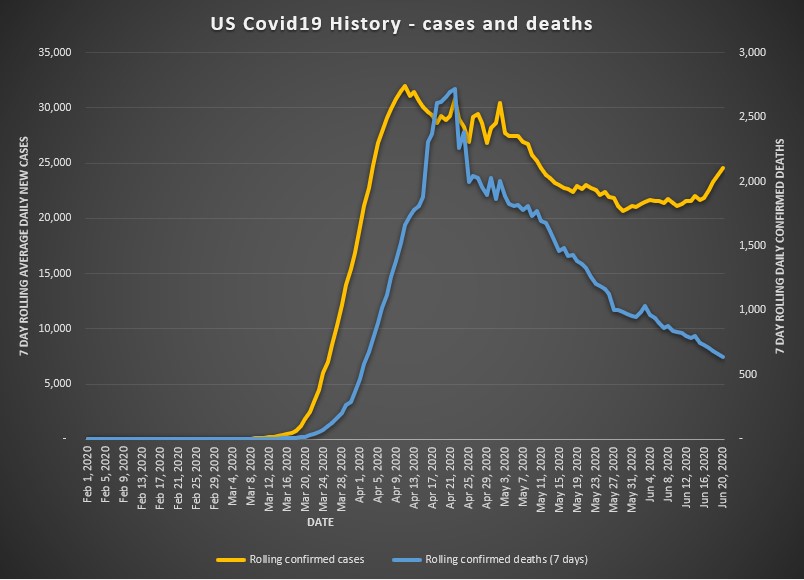
It shows fairly clearly that in the first massive increase in cases and deaths, in March and early April (which was mostly in New York), deaths did tend to lag behind cases by a couple of weeks. But while cases have stayed reasonably steady around the 20,000 – 25,000 cases per day since early May recorded deaths from Covid19 have continued to fall. So it can’t just be that deaths are lagging cases – there must be more going on.
This next graph confirms that by looking at two things – the number of tests it takes to get a positive result, and the case fatality rate calculated deaths over a seven day period divided by the number of new cases identified over a seven day period two weeks earlier.
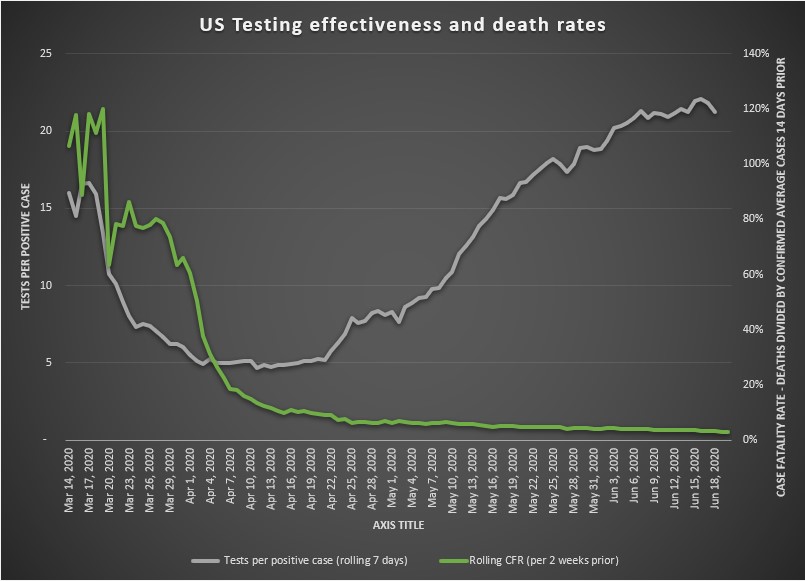
This graph shows a couple of things. Firstly, the effectiveness of testing in the USA is improving. It has been improving fairly consistently since mid April. It now takes more than 20 tests to find a positive result (for comparison, here in NSW over the last seven days we had more than 4,500 tests for each positive case). The WHO’s previous guidance suggests that this is almost enough. At the WHO media briefing on 30 March, Dr Michael Ryan expressed this in terms of the positivity rate (the inverse of the number of tests per case):
“…In general where testing has been done fairly extensively we’ve seen somewhere between 3 and 12% of tests being positive… we would certainly like to see countries testing at the level of ten negative tests to one positive as a general benchmark of a system that’s doing enough testing to pick up all cases.“
And the Case Fatality rate (the percentage of cases that are fatal) has also been dropping over that timeframe, with the most recent rate being around 3%. This suggests that more of the mild cases are being identified, as there is no evidence anywhere that the underlying disease is less severe. Increasingly the consensus is that the underlying infection fatality rate is around 1-1.5% (see this study, for example). So it would seem that in the US an increasing proportion of total infections are being identified, perhaps as many of half of those infected are being identified (the study I linked earlier estimates 45%).
What about recorded deaths? A quick reminder, almost everywhere in the world where Covid19 has been severe has had more excess deaths than deaths attributed to Covid19. The Economist is keeping this information up-to-date where possible. Unfortunately the US death information is only reliable up until early May, so there is no evidence one way or another of whether the states that are now increasingly affected by Covid19 are more or less likely to be recording deaths accurately.
But now that the testing rate is reasonably stable, the increase in cases is likely to lead to an increase in deaths – lagging by 2-3 weeks. At the current level of testing, a 3% death rate is plausible. So the daily cases inching up from 20,000 to 25,000 in the USA would lead to deaths increasing from 600 per day to 750, and more if cases keep increasing (which sadly seems likely given how much ).
Link
This article in Wired magazine profiles a virologist, Nathan Wolfe, who went from talking about the risk of future pandemics to trying to develop an insurance product against them.
In 2015, Metabiota had partnered with German reinsurance giant Munich Re and American insurance brokerage Marsh to develop and sell a policy specifically to guard large businesses against pandemics—to stanch the financial losses and keep them afloat. They’d launched it in mid-2018, a year and a half before the first Covid-19 cases appeared in China….
How must those CEOs feel, I wondered aloud, who had the foresight to buy the world’s first pandemic business insurance? What a story they would have to tell.
There was just one problem. “By and large we failed,” Wolfe said. “Not because we didn’t do the models well. We enabled the first business-disruption insurance for pandemics. But nobody bought it.
It’s a great article, for the general reader as well as the insurance professional. It is always interesting to read why people don’t buy insurance, even when they understand that a risk exists.
Glimpses
I’ve started thinking a bit further ahead than the next few weeks as we increasingly adapt to this Covid19 world. And this week, a few things appeared in my diary for 2021! One was a series of six meetings that should, in theory, be in Melbourne. I’m going to be surprised if I fly to Melbourne for all of them even if we are allowed to. My prediction is that business travel is going to reduce substantially now that we have all had a taste of how effective a meeting can be when run remotely. While remote meetings were often very poorly managed in the past (particularly if only one person wasn’t there in person) everyone I work with now has got over their reluctance,and figured out how to make it work. It’s still going to be hard to be the one person not there in person, but business travel will be taking a long time to get back to where it was.
As I checked my availability for 2021, I did still make sure I left space for the Tokyo Olympics in July. I’ve got tickets, so I’m not giving up on them yet, even if I think the chances are less than 50%.
Bit of beauty
I decided to have another go at a picture of Lavender Bay – it’s a shame the ferry no longer runs regularly from this wharf, but it is still a beautiful spot to linger in.

Of course they’re is one other explanation for cases rising, but deaths falling, a variant on”hospitals not being overwhelmed” I suppose: they’re getting better at treating it.
In the US’s case, this may simply mean they’ve stopped taking Chloroquine and drinking bleach.
I know of no evidence one way or another for this, though you would hope that three months in, they’d have learned a thing or two.
Very good point Peter, I did forget to mention potential treatment improvements. From everything I have read treatments are better (they know when to give oxygen, etc) and they are also helped by hospitals not being overwhelmed. But the impression I get is that the improvement is at the margin (1.5% death rate might go to 1.4% for example) whereas the difference in death rates we are seeing in the US is much greater.
My comment disappeared, maybe you
Will get it. Love the Lavender Bay photo, do keep visiting it. Love Marta
One other point to note is that there is a big difference between various states. New York and New Jersey for example have continued to see reductions in case numbers while testing has expanded (like we saw in the hardest hit European countries), but this has been swamped by increases in other states (California, Florida, Texas, Arizona).
The US is definitely a collection of localised outbreaks, but it seemed to me that aggregating the data was still reasonable. But you make a good point that maybe the testing levels are quite different between outbreaks which could make the averages less meaningful.
Hi Jennifer
Thanks for this post and for your blog – always a great read.
I have been really intrigued by the case fatality rates (CFR) especially as the pandemic has spread in the USA. International statistics appear to show similar CFR in terms of detected cases vs deaths, in Italy, France and England (once Previously unrecorded Covid deaths were incorporated). But in the US the Overall CFR appears much lower – I was wondering if one cause was the patchy geographic intensity of the spread of the virus. While cases were appearing across the US, some areas were very hard hit such as NY while other Other areas had much less cases and could cope better with increased hospitalisations and do better testing, thereby decreasing the CFR. I am wondering if the CFR In NY is more like Italy, France and England and the US CFR will rise as more areas have intensified case loads.
Thanks for doing the two articles on Aboriginal incarceration in light of Black Lives Matter. As you know it’s been a big issue at work and some commentators have been running the line that death rates for non Aboriginal vs Aboriginal prisoners is roughly the same so therefore what is the big deal (forgetting of course that because as a percentage of the population there are Significantly more Aboriginal people in custody compared to non Aboriginal and therefore significantly more Aboriginal people die in custody as a percentage of the Population).
You maybe interested in the BOSCAR publications on Aboriginal incarceration rates – See here
https://www.bocsar.nsw.gov.au/Pages/bocsar_topics/bocsar_pub_atoc.aspx
Don Weatherburn from BOSCAR did a seminal seminal study – see review here
https://www.researchgate.net/publication/285871521_Don_Weatherburn_Arresting_Incarceration_Pathways_out_of_Indigenous_Imprisonment
The study basically concluded as a colleague of mine bluntly put it “Aboriginal people are more likely to be in in prison because they are poor” (or as the study concludes Aboriginal people have increased crimogenic risk factors such as high unemployment, low educational outcomes, high drug and alcohol issues, and disrupted parenting).
My colleagues at work would also argue racism and discrimination in the justice system is still rife, with many having experienced or witnessed it themselves, which of course contributes to the high incarceration rate.
Angela