
Did more than 60,000 cases of Covid19 go undetected in Australia before the second wave in Victoria? It’s possible. But I don’t think the new widely-reported study adds any strong evidence for it. You’ve probably seen reporting of this (not yet peer reviewed) study, suggesting that perhaps 60,000 people in Australia have had undiagnosed Covid19.
On the day it was released, this study was a bit of a Rorschach test. The first two tweets I read used it to argue (1) that Victoria’s lockdown should be lifted immediately (because the death rates from the virus were not as high as previously thought) and (2) that Victoria’s lockdown should last longer (because there was so much more virus in the community than anyone thought).
The study took blood samples from 2,991 people who were having elective surgery during May and June 2020. Using a new two step process test for antibodies, they checked those blood samples for antibodies to Covid19. A total of 41 of those samples were positive to their first test – suggesting that 1.4% of their elective surgery patients had had Covid19.
But here is the counterintuitive part. When they tested their new test, they found that 1.1% of all positive outcomes were false positives. In other words, if you tested 1,000 people, 11 of those people would have positive tests, when they were not really positive. 1.1% doesn’t sound like a very big deal. But when there is very little Covid19 out there, the false positives outweigh the true positives.
If all of those 2,991 people had not had Covid19, then 33 of them would have tested positive anyway. So of the 41 positive tests, the authors estimated that only 8 were really positive.
But then they performed the second step of checking using the test itself:
In this analysis 15 individuals remained above the 100% specificity cutoff (Figure 2B), however plotting the RBD and N values showed that only 5 samples were strongly positive for both antigens, clustering with our positive controls [previous tests of blood taken from known positive patients].
In other words, the next step left them with only five positive samples from the two step process.
So how do you get the estimate of 60,000 undiagnosed Covid19 cases? The calculations are in the paragraph below. .
We estimate a seroprevalence of 0.28%, which – given a population estimate for Australia of 25.50 million individuals – equates to 71,400 infections (95% CI: 0 to 181,050). At start of sample collection (2nd 216 June) 7387 cases/102 deaths had been reported in Australia, rising to 11,190 cases/116 deaths by 17th 217 July when sample collection finished suggesting that testing was capturing 10-15% of cases and that there was a low case fatality rate, similar to other jurisdictions with high testing rates.
So what are the implicit assumptions in this number of 60,000 missing cases?
- The biggest assumption is that the elective surgery patients are assumed to be representative of the population as a whole – in particular that they are representative of the people who might have been exposed to the virus.
- The team relies heavily on their calculated false positive rate of 1.1% being perfectly accurate. This gives a precise answer of 33 false positives (the team could also justifiably have used the 5 positives they got from the two step process for a seroprevalence of 0.17%, which would have reduced the headline 60,000 unidentified cases to around 30,000).
More broadly, the key piece of information from the study’s concluding paragraph is the wide range of possible infections. The paragraph above suggests the range could be from zero to 181,050. Obviously 0 is too low (given there were already 7,387 cases when the study began). But given that range (and you can see why it is so big when you start to look at the false positives), the reporting of the study puts far too much precision around the specific central estimate. It tells us nothing we didn’t already know.
I’ve written before that we undoubtedly missed cases in the first wave. And this research from the Actuaries Institute suggests that there were also more deaths from Covid19 than have been identified. But I don’t think this new antibody study tells us anything particularly useful about how many cases might have been missed or what the true underlying death rate is.
Update
I’ve updated my graph of NSW contact tracing since my last post. There has been a slight increase in healthcare transmission, as the Liverpool Hospital cluster is now being analysed as two clusters – Liverpool and Concord Hospital. Still, the virus is largely transmitted in households and cafés and restaurants. Given how much of Victoria’s transmission is still in healthcare settings, I hope some of the lessons about mask fitting and PPE have been learned in NSW from Victoria.
![]()
Link
This article by Joshua Gans (Australian/Canadian economist) looks at how effective a vaccine needs to be to enable us to return to normality. Unfortunately the answer is “much more effective than the levels that will satisfy regulators”. It’s hard to summarise, but well worth a read. Here are a couple of quotes to whet your appetite.
If a vaccine is 50% effective, then we may not wipe out the virus even if everyone is vaccinated. With lower coverage, a vaccine has to be more effective to do its job. To be sure, the scale of the reductions even with a less effective vaccine are great and worthwhile. The problem is that the virus remains with us….
The point of all of this is not to discredit the good work being done to give us a vaccine. Instead, it is to caution us on what news of ‘success’ might mean. What it does not mean is a return to normal. What the vaccine becomes is just another tool in our kit on how to reduce transmission rates and protect people from Covid-19. We should view it like that and, indeed, not make presumptions that we might end the economic and health damage from the virus in any clear way.
And this article about Mumbai’s experience so far with Covid19 is both enlightening and sad:
Attempting to trace Mumbai’s Covid-19 story teaches us a number of lessons. It shows us that the coronavirus is not a great leveller and spreads much more rapidly in poor housing. There are probably no magic bullets when it comes to controlling Covid-19 in slums. And it teaches us to be cautious about the stories we spin around data: for example, case numbers in different areas may not accurately reflect the geographical spread of the disease, and naively calculated fatality rates could be very wrong.
The article reminded me how little I have heard about India’s experience beyond the very first stories of the lockdown in March and the vast numbers of people attempting to travel home. Sadly it seems plausible that parts of the Mumbai slums have achieved herd immunity, at a cost that hasn’t been able to be measured. And the disease is now (more slowly) moving through the middle class areas of Mumbai.
Life Glimpses
While NSW hasn’t been fully locked down since May, we have certainly been enouraged to avoid crowded places, like public transport. So I’ve been cycling more, for transport as well as for exercise. And I’ve found that translating into quite a few letters to my local MPs and councillors, to improve the cycling infrastructure in Sydney. If you’d asked me a year ago which cause would take my attention enough for me to voluntarily write letters to people, I would not have expected it to be cycling!
It has been lovely to try out some of the new pop-up bike paths that the City of Sydney has been putting in place. Using this clever route a cyclist put together you can try them all out almost entirely on separated cycle paths. This week I tried the section that goes to Centennial Park (where I haven’t been for years) and as a bonus, saw the powerful owl and her three chicks that a friend told me about.
Bit of Beauty
I’ve always loved this time of year in Sydney – spring in the European calendar. The local indigenous calendar has six seasons not four, and this season is called Ngoonungi. It runs roughly through September and October, which makes a lot of sense to me, as November is when the humidity starts, and it feels quite different to the rest of spring. A long digression to explain today’s bit of beauty – a waratah, or Miwa Gawaian (Telopea speciosissima), is one of the key signs of this season according to the indigenous calendar. So my bushwalking friends and I found some waratahs! I don’t think I’ve ever seen them in the wild before.
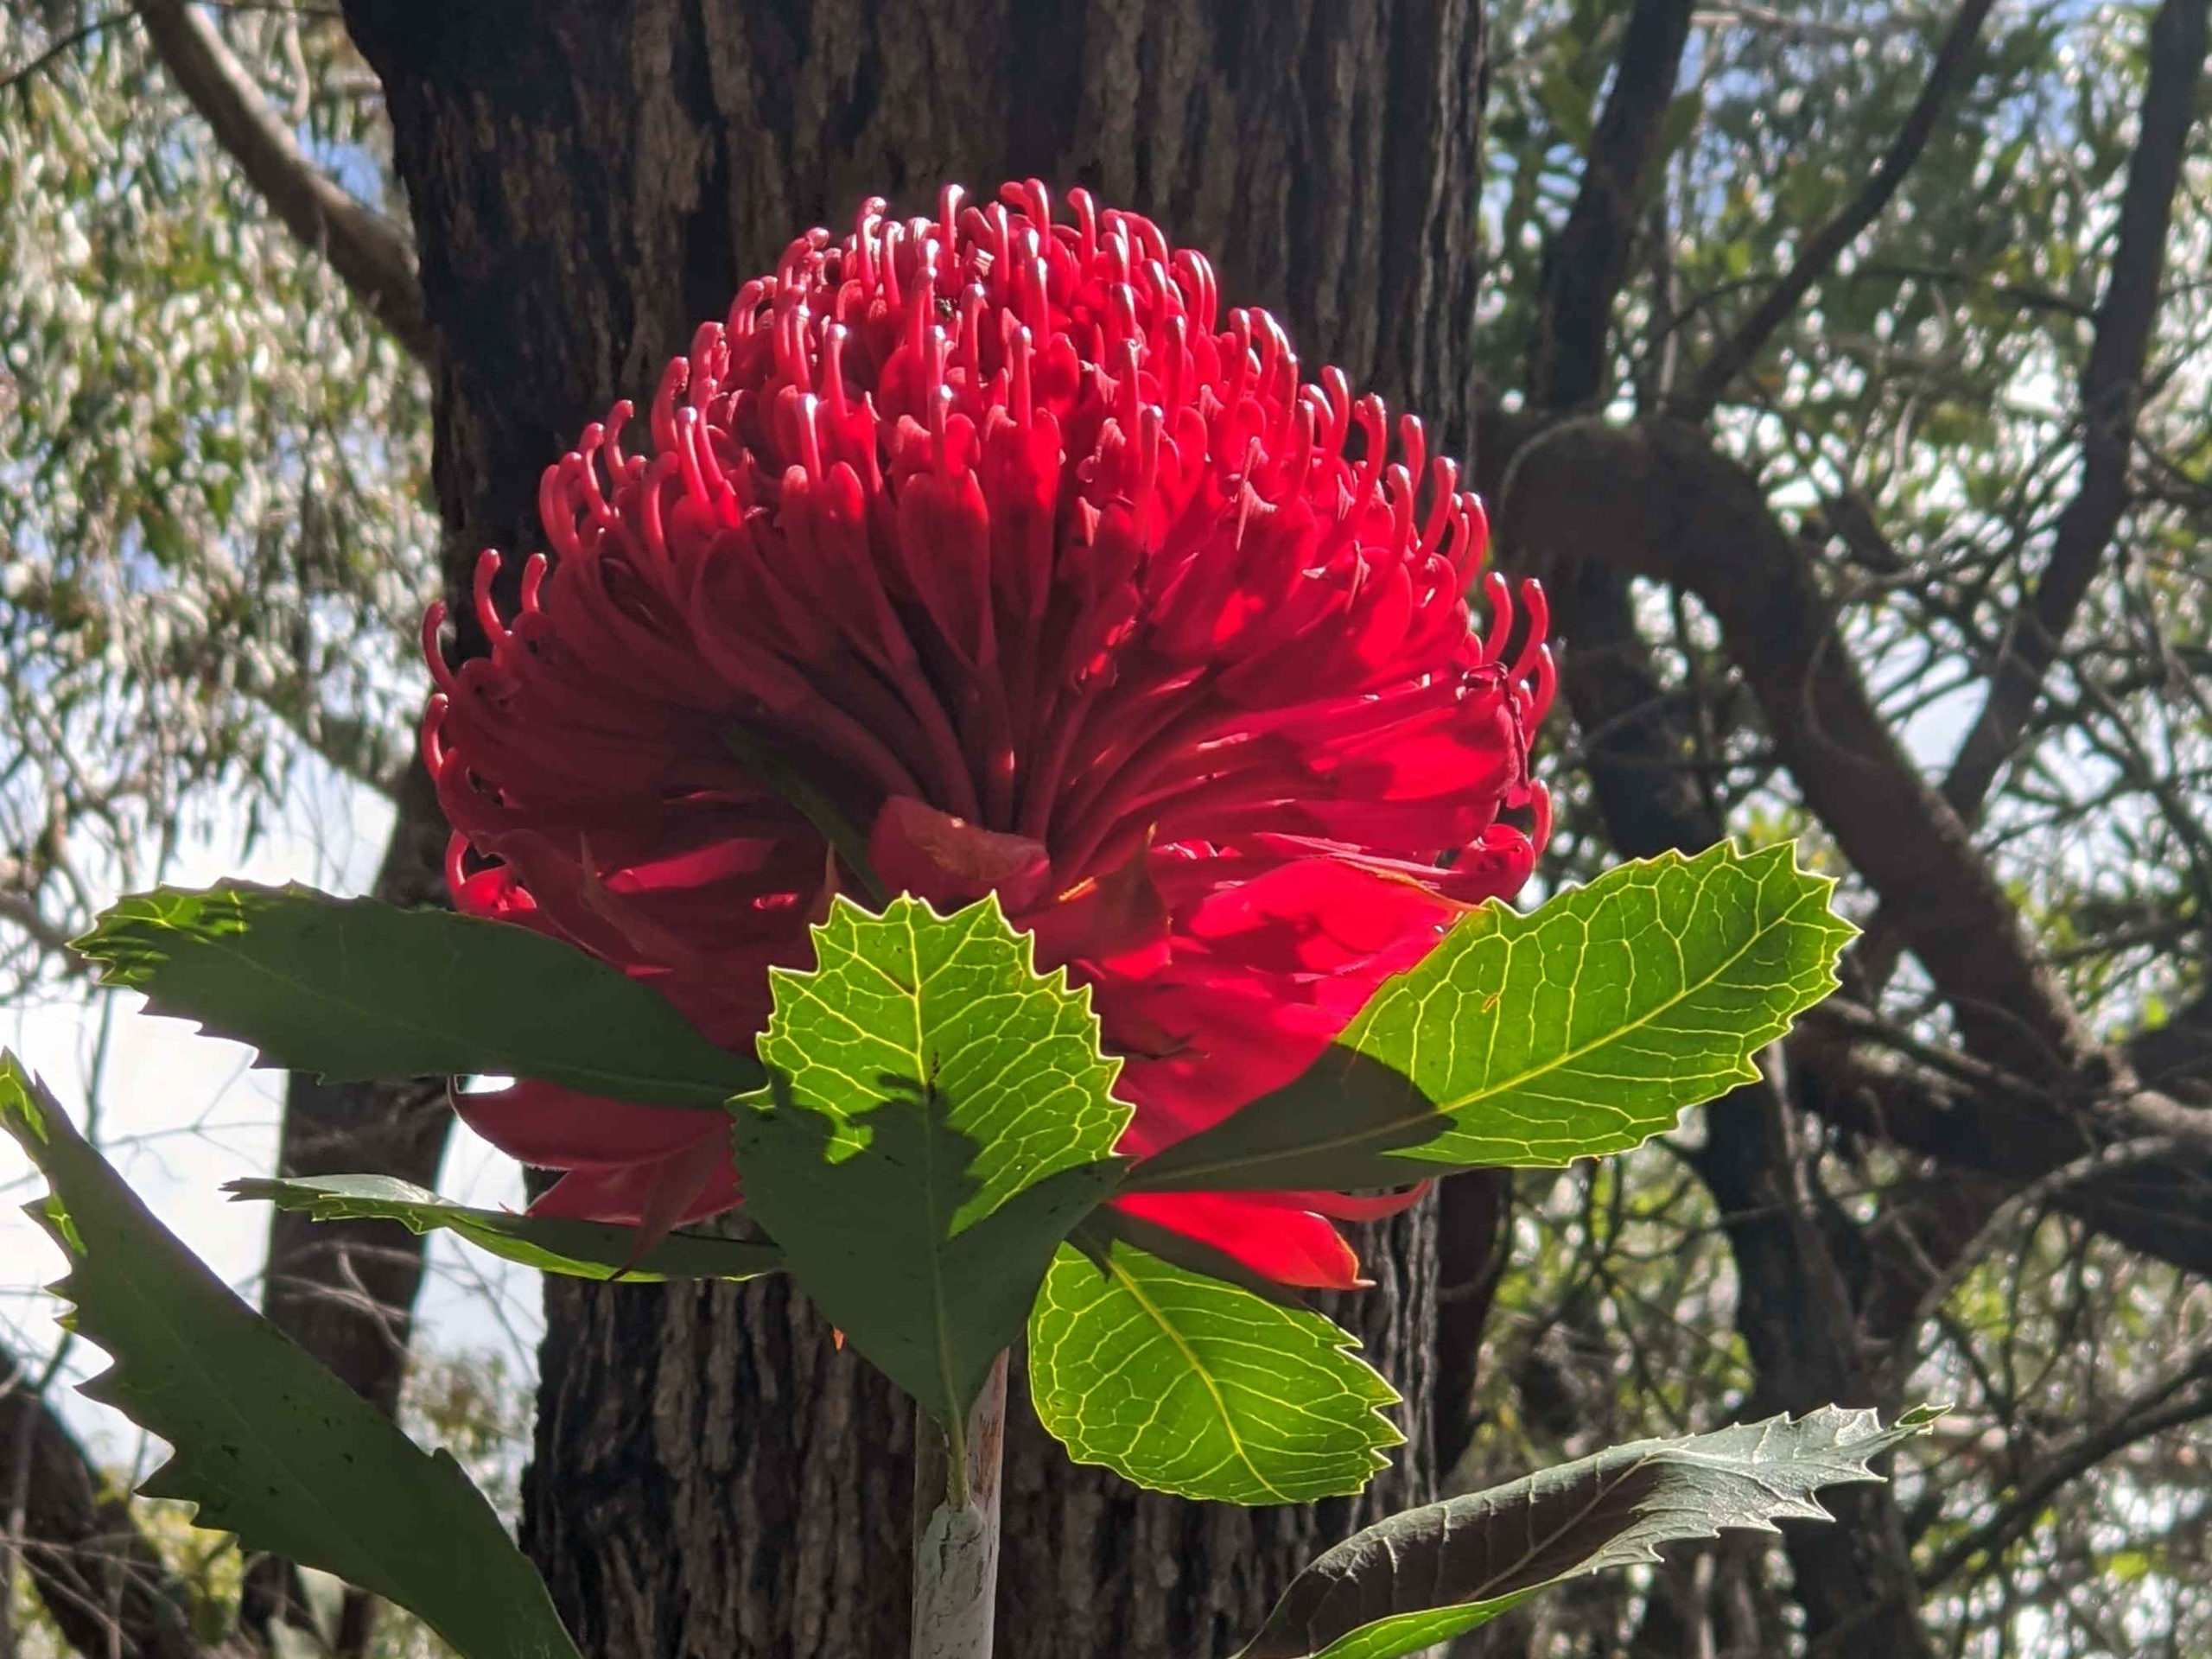
What a lovely photo of the Waratah, In our garden in Bilgola Plateau we had 2 Waratah bushes, not from a nursery. Pittwater Council asked permission to take seedlings and some branches . I cannot comment on the serious subjects you raise. We have a lockdown but it seems to be a farce, I will not elaborate. love
Hi Jennifer, I have really enjoyed reading your emails over the past months during the pandemic. One glaringly obvious problem with the study you have discussed is that it was based on an assumption that elective surgery patients were representative of the general population. A large proportion of these patients would have been older than 65 and many in frail health. It is quite flawed, and as always it is dismaying to see certain media broadcasting such findings and raising public anxiety further. Sue
Hi Jennifer, I agree with Sue that the elective surgery patients are very unlikely to be representative. I think one other major flaw in the study is that it uses data from 4 states and applies the results to the whole population of Aust. Of the 4 states examined, only two (NSW and Vic) appear to have any samples that are positive for COVID antibodies (Fig 2a), and the “PW” which I assume is the Prince of Wales based in Randwick, has much higher antibody readings than the other sites. This is entirely what I would expect given what we know of where clusters were in wave 1 (Bondi restaurants and backpackers) i.e. that undiagnosed cases are higher in eastern suburbs of Sydney than elsewhere in Sydney or Vic, and that there was little undiagnosed virus in WA and SA. Karen
Excel tells me (because I’ve forgotten how to do it myself!) that 2991 tests with a false positive rate of 1.09% have a 98.0% chance of generating 22+ false positives and a 3.2% chance of 44+ false positives. In other words, the 95% confidence interval for this test is the range 22-43, which contains the observed result of 41.
If we make it a one-sided test (which I’m sure we shouldn’t), we would be looking at the range 0-42, since there’s a 4.5% chance of getting 43+ false positives.
So the correct finding of the study would be that there was no significant evidence that they found anyone at all with Covid-19 antibodies!
But where’s the news in that?
Thanks Richard, I really should have done that myself, luckily you have remembered your stats better than me…