
In NSW in this wave of Covid19, are hospitals starting to ration care and send more sick people home as they run out of space? The statistics suggest that hospital in the home is being used more and more to take the pressure off hospitals. But some of the reduction in hospitalised cases could also be vaccination starting to reduce the seriousness of Covid19 illnesses.
The statistics are very difficult to find. NSW reports daily (on twitter) on the number of people in hospital, but weekly, in a completely different reporting area, on the total number of people in “Hospital in the home” and weekly, more slowly, on the age distribution of people admitted to hospital (among many other useful statistics).
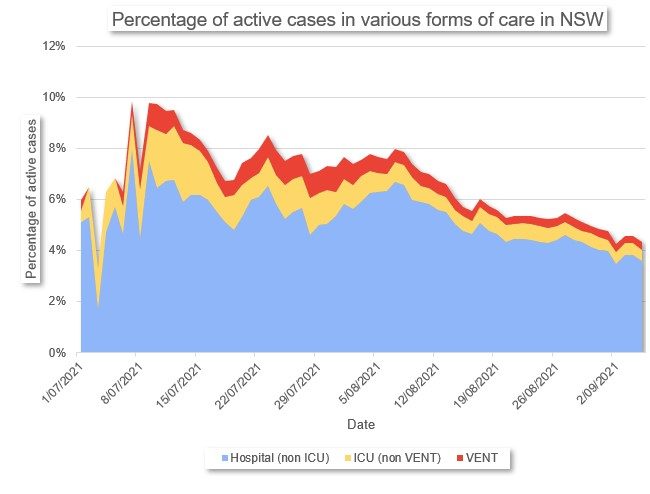
This graph shows the timeline of the percentage of active Covid cases in NSW who are in hospital care since the current NSW wave really got going. The care ranges from being in hospital in general wards, to being in Intensive care (but not ventilated) to being ventilated. The numbers are percentages of total active cases†.
This graph appears to show that the percentage of all Covid cases in hospital has been diminishing, in general, in this wave of Covid, from a peak just under 10% to just over 5% now at the beginning of September). But if we include those in hospital in the home‡, then the picture isn’t quite as rosy.
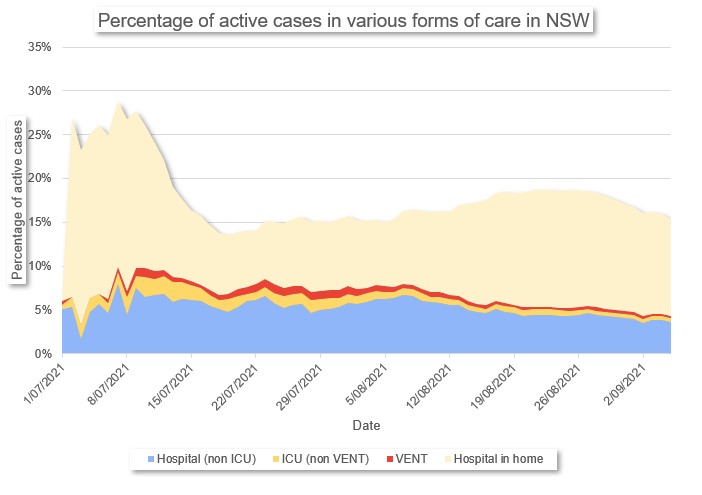
Including all those in hospital in the home, it appears that quite a lot of the reduction in rates of hospitalisation between early August and early September is a substitution of hospital in the home care, rather than admission to the ward of a hospital. And actually the overall proportion of people in some form of formal care (as a proportion of cases) is going up not down.
Between the beginning of this wave, and early September, the proportion of active Covid19 cases in the each of the most intensive forms of care has reduced at each stage. There is anecdotal evidence of pressure on hospitals, which (we know from other countries going through this) is likely to lead to patients being provided with lower levels of care at the same illness, as there just isn’t enough of the highest level available. But at the same time, the proportion of people in NSW who have been vaccinated has been rapidly increasing during this period, which is also likely to lead to some reduction in the level of care required.
The truth is probably both vaccination and saving the highest levels of care for sicker patients. While the guidelines for care haven’t changed for who gets admitted to higher levels of care, marginal decisions (either by the patient or their carer) are probably more likely to be biased towards lower levels in a system under pressure.
Vaccination is almost certainly starting to make a difference, but without more detailed, granular, age based and vaccination status statistics at each level of hospital care, it is hard to see how much. Vaccination has the largest effect of reducing serious illness two weeks after the second dose. The proportion of the NSW adult population in this status was 8.1% on 1 July, and 30.8% on 21 August. Transforming those numbers into the whole population, that’s 6.5% to 24.6% increase in vaccination – or around 18% more people, who even if they catch Covid19, have 85% less chance of being ill enough to be in hospital. If (big assumption) those who are exposed to Covid19 are representative of the population who is vaccinated, then vaccination should be reducing hospitalisation rates by 15% – for example a 17% hospitalisation rate would become 15% hospitalisation.
All these statistics are a mixture of measurements – some are admissions, some are numbers of people in hospital at any given time. I’ve chosen to measure the situation at a given time here, but to look at the pressure on hospitals, a more forward looking measure is the new admissions to hospital in any given period.
† Active cases are defined by NSW health as those who have tested positive for COVID-19, are in isolation and are being clinically monitored by NSW Health.
‡ NSW Health defines HITH is a hospital substitution program which means that the person having Hospital in the Home would otherwise have to stay in a hospital. Access is needs based and available regardless of age, diagnosis, disability, geography, culture or gender. The objective is to provide patient centred care as close to home as possible.
Links
A lot of people sent me this piece by Freelance CEO Matt Barrie – a fairly scathing critique of the Doherty Report. It is worth a full read – the two main points it makes are about the length of the model:
They only run the simulation for 180 days. So the model is producing garbage.
They’ve simply stopped the simulation before the effects of opening up play out. There’s no reason I can think of to cut a model off at 180 days other than to fudge the data. Furthermore, respiratory viruses are seasonal and you’ll have different results whether the 180 days are in summer or winter.
It becomes even more ridiculous when you look at events that take time to play out (i.e. outcomes lag). For example, infections lead to occupied hospital beds, which some time later, may lead into need for an ICU bed, and some time later lead to a death.
and the strong reliance of the model on effective test trace isolate and quarantine:
Doherty model is premised on mythical “test trace isolate & quarantine”.
Doherty “test trace isolate & quarantine” assumed in the modeling is based upon the performance of the Victorian public health response at the height of the ‘second wave’ in 2020. These cases peaked at 700 per day. In the best case scenario in the Doherty modeling the cases peak at over 55,000 a day (up to 120,000 a day). The assumption that public testing, tracing, isolation & quarantine can perform at the levels Victoria performed at 700 cases a day is fantasy.
Matt Barrie is more scathing than I would be about the modelling itself. But I agree with his main point that the Doherty report is being quoted in support of a whole lot of conclusions and proposed actions that are not supported at all by the report (eg “Prime Minister Scott Morrison says Australia “has to move forward”, ditch lockdowns and open up after it hits 70 per cent of the population fully vaccinated” in nine news).
The federal government (after a lot of pressure from Aboriginal Health services) has released the vaccination rates for indigenous people in Australia. And they are just as low as I feared. The worst area for vaccination rates in NSW (Far West and Orana) also has the most indigenous people (by number as well as proportion of population). They have 13.7% of the adult population fully vaccinated, compared with 37.8% of the population. And in WA, the two areas with the lowest indigenous vaccination rates are the lowest in the country – 7.3% and 9.6% for the two outback areas in WA that have around 40% of all indigenous people in WA.
Life glimpses
We continue to have zoom cocktails/500 games with friends on a regular basis; this time with an added degree of difficulty – deduction of 250 points for any mention of Covid. We managed to avoid the word until the very end of the evening yesterday – the games themselves ended up at one each without any points being deducted. Although there was a little bit of discussion of which local supermarkets were exposure sites.
In our daily look at the press conference in NSW, we have a new game – find something interesting from history in the year associated with the number of cases. Yesterday’s case number of 1485 is associated with the Battle of Bosworth Field – when Richard III died yelling for a horse, and was replaced on the English throne by Henry VII (father of Henry VIII). Unfortunately as one of the family pointed out, this game won’t last much longer at the current growth rates, unless we want to start predicting the future.
Bit of beauty
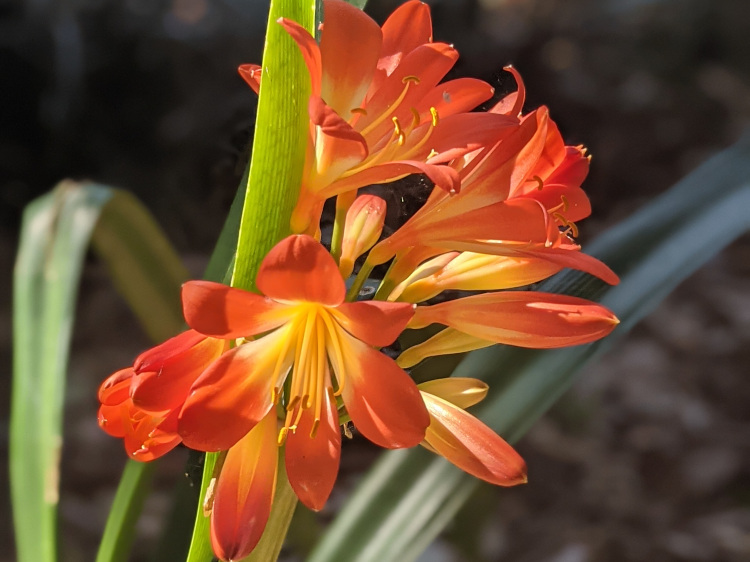
A friend has challenged me to name some of my flowers correctly (always a challenge for me as those who noticed my incorrect naming of a passionfruit last year will know!). Apparently this beautiful flower (which is very common around here at this time of year) is called clivia miniata.
Hi Jennifer, Great to see you challenge the assumptions and implications of the modelling. It would be really interesting to see your views on what we can expect to see for children if our national plan plays out. We need a fact check on the political views!