Now that we have the biggest Covid19 outbreak yet in NSW, what is the impact likely to be on hospitals? A fast growing outbreak with lower hospitalisations is still likely to lead to more total Covid19 hospitalisations than we have seen here so far in the pandemic.
With over 20,000 Covid19 cases on 31 December, but Omicron being potentially a milder variant of Covid19, and the majority of the Australian population having two vaccinations, we’ve been told to pay closer attention to hospital statistics, rather than case numbers. So how are they going? I’ve taken a close look at NSW, as we are the first state in Australia to have a full blown Omicron outbreak.
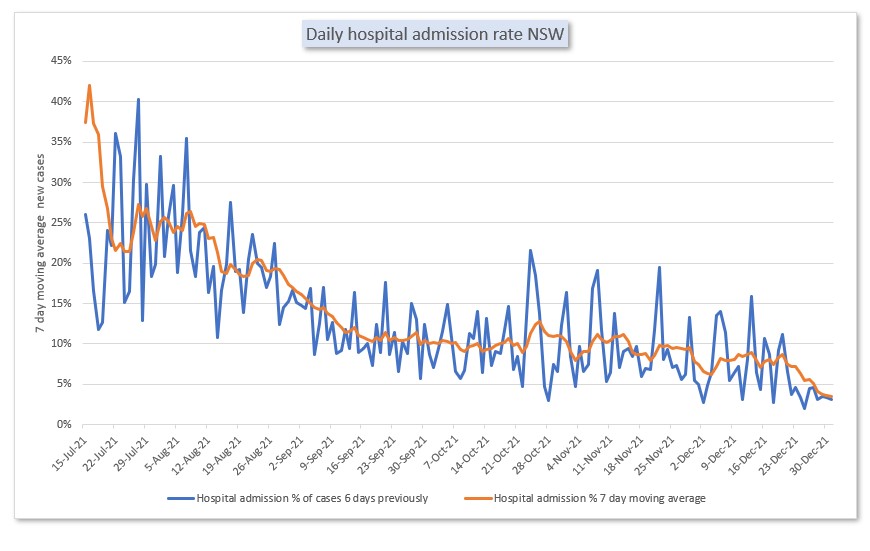
As expected (because vaccinated people are being infected), Omicron does seem to be leading to a lower hospitalisation rate per case. New Covid19 hospitalisations have reduced from around 25% of all cases at the beginning of our Delta wave in July/ August 2021 to around 10% – post vaccination but pre Omicron – to around 3.5% of all cases at the end of December 2021.
But with the daily cases doubling every 5 days in NSW and Australia, only 3.5% of all cases being hospitalised is a still a lot of people.
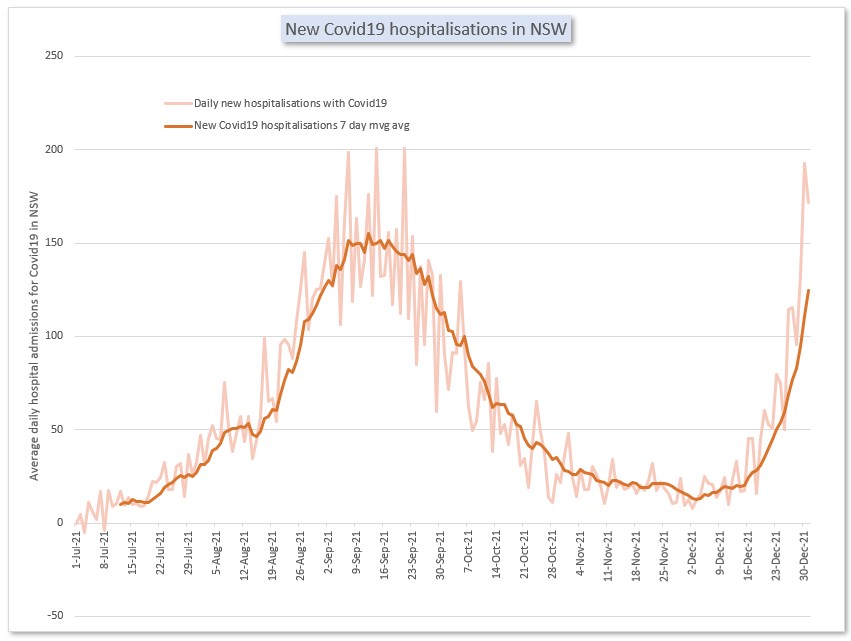
This graph shows my calculation of the number of new hospitalisations with Covid19 every day in NSW over the last six months.
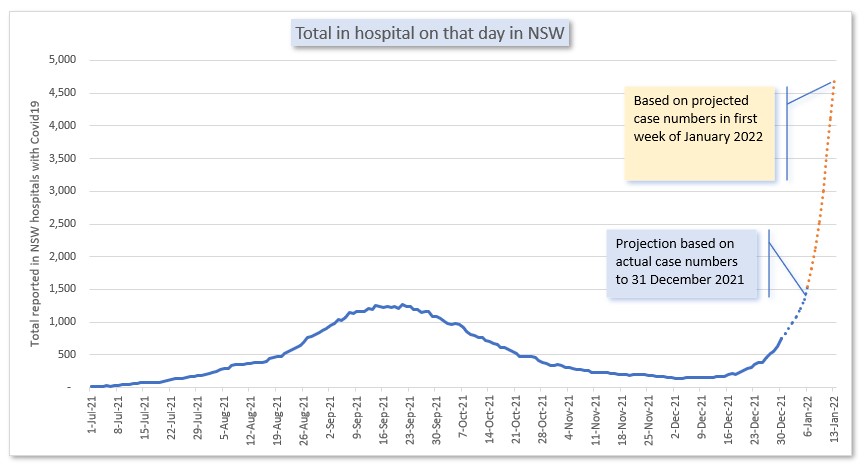
In Australia, unlike a lot of other countries, the only number that is released daily about Covid19 hospitalisation is the total number of people in hospital that day with Covid19. That helps understand the current strain on our hospital system, but it is a lagging indicator to understand how bad our current wave is. So I also projected the likely situation for the next two weeks, using current case numbers, and the parameters for hospitalisation I’ve already calculated.
This projection shows that based on current case numbers, assuming current hospitalisation rates continue, there are likely to be more people in hospital with Covid in NSW at the end of the first week of January than there were at the peak of the Delta wave. And projecting current case growth rates, the number of people in hospital is likely to double again in the second week in January.
I suspect that before this many people are admitted to hospital with Covid, the NSW hospital system may start triaging cases more stringently than they have in recent weeks, both by admitting fewer patients, and also discharging patients earlier in their recovery. So the numbers in hospital in NSW in mid January will probably be lower than this projection. However, this projection shows again that a milder, but more infectious disease, still can stress a hospital system as much as a less mild disease which is spreading more slowly, as the exponential growth in cases creates many more serious cases – a small percentage of a large number is still a large number.
Calculation methods
I looked at the England daily hospitalisation statistics to calculate the daily rate of discharge for Covid19 patients in hospital as 11.5%. I then used that number to calculate a daily admissions number for NSW since 1 July 2021, using NSW’s daily COVID hospital statistics collated by @migga.
I then calculated the daily hospitalisation rate by dividing each daily admissions number by the equivalent case numbers six days previously (as NSW health documents 6 days from positive case to hospitalisation). That number has been coming down since October, as increasing proportions of the population are vaccinated. It has dropped again in the last week or two, but fluctuates a lot.
Then to project hospitalisations, I took the average of the last week’s admission rate, and multiplied it by cases that have been reported already over the past 6 days. And then finally I used my existing projection approach for NSW cases (take the last 7 days average growth rate) to project hospitalisations using the same admission rate for another week.
To look at the total in hospital with Covid19 for each day until the middle of January, I used the same daily discharge rate of 11.5% and added the daily admissions.
For that final graph, there should be a range around the dotted lines – there is a lot of uncertainty there. I’ll report back on how I went with my projections in mid January. I do hope the hospitalisations are lower than my projections, and not because the hospitals run out of room.
Links
The Guardian has an interesting article from the UK about guidance versus rules – which works better? This has been a really important question for governments throughout the pandemic.
Prof Stephen Reicher of the University of St Andrews, and a member of Spi-B – the behavioural sub group of Sage, said that whether advice alone works depends on three key factors – the first of which is whether the source is trusted. Another factor, said Reicher, is whether the message is clear and the reality of the risk set out. Finally, Reicher said people need support to self-isolate, make classrooms safe and improve ventilation in public spaces.
And this fascinating study from Europe looks at the evidence of the effect of various public health measures (particularly lockdowns) on mental health – using an existing survey of the mental health of around 50,000 adults over 50 in 26 different countries. The study looked rigorously at many variables that might be associated with mental health, and the natural experiment of different levels of lockdown and existing supports.
We found a substantial deterioration in mental health in persons aged 50 years and older between the beginning of the pandemic and June to August 2020. This was strongly associated with greater severity of physical distancing measures and exhibited substantial social inequalities, with people with poor and fair health, foregoing healthcare, women, and persons who experienced job loss and financial hardship during the pandemic suffering the most. Importantly, however, stronger social protection systems, as measured by greater spending, appeared to mitigate the risk of worsened mental health.
Our study has implications for policy. It reveals how the adverse impacts of physical distancing and closures are not inevitable. Increased spending on various social protection benefits, including healthcare, unemployment, and a package of social protection benefits seems to ameliorate the risk of mental health deterioration.
And this article in the Atlantic describes all the mistakes the US keeps making in responding to the twists and turns of this pandemic. The difference (on reading this from Australia, rather than the US where the authors are based) is that here in Australia, we’ve decided to make some of those mistakes for the first time.
With Omicron, everything is sped up. The new variant is spreading fast and far. At a time when Delta was already sprinting around the country, Omicron not only caught up but overtook it, jumping from an estimated 13 to 73 percent of U.S. cases in a single week. We have less time to make decisions and less room to course-correct when they are wrong. Whereas we had months to prepare for Delta in the U.S., we’ve had only weeks for Omicron. Every mistake gets amplified; every consequence hits us sooner. We should have learned after living through multiple waves and multiple variants of COVID, but we haven’t, at least not enough. We keep making the same pandemic mistakes over and over again.
- We rush to dismiss it as “mild.”
- We treat vaccines as all-or-nothing shields against infection.
- We still try to use testing as a one-stop solution.
- We pretend the virus won’t be everywhere soon.
- We fail to prioritize the most vulnerable groups.
- We let health-care workers bear the pandemic’s brunt.
Life glimpses
 It’s been quite sobering to read the world Covid news and realise how similar the Omicron experiences are around the world to our own here in Sydney. It has made me realise that even in our most recent winter lockdown in Sydney, I was still feeling a bit smug about how well Australia had done in managing this pandemic. This time, though, there doesn’t seem to be any reason for smugness.
So far none of my immediate household has tested positive, but two members of the family have been close contacts of positive cases. They were both required to isolate for the later of 7 days or a negative day 6 PCR test. The first result came back two and a half days later and we’re still waiting for a result for the second test seven days after the test. After 4 days of isolation we decided enough was enough, and that two negative RAT tests was enough for our second close contact to rejoin the family. Today it has been a full 14 days since the close contact event so the results will be completely academic when (or if?) they come back.
While a positive Covid test and illness would have been much worse, it was sad having nearly two weeks of family members locked in their rooms, particularly one of them over Christmas day.
Bit of beauty
This flower from the neighbourhood, which we’ve walked past every day for months, was particularly lovely when geekinsydney looked closely.
My bit of beauty, on the last day of 2021 is a good time and place to say thank you to all my readers for being on this year’s trip around the sun with me. Particular thanks to everyone who commented or gave me feedback here or elsewhere (even a few in real life!). Having this blog provide focus for my Covid19 reading has been helpful for me to keep perspective, instead of doomscrolling, and I’m glad it has been useful and interesting for others to read.
I wish you all the very best for the coming year, and I hope in 2022 you find a bit of beauty every day.


Thank you Jennifer for your insightful analysis and commentary. It’s always a great read. Happy New Year to you and your family and best wishes for 2022.
Thanks Brian, happy new year and all the best for 2022.
What Brian Greig said.
Thanks! Happy New Year.
Thanks, Jennifer, for sharing your analysis to save us from the doomscroll! Happy new year.
Happy new year Fiona, see you soon!
Thank you for the bit of beauty.
The serious part of the blog is beyond me.
Healthy 2022, now it seems so important.
Love
Thanks for being such a steadfast commenter, Marta, and always giving us the news from Israel!
Thanks, Jennifer,
If I can be permitted to be cynical, it suits the politicians to say “look at the hospital data” and then report little hospital data. I appreciate your insights to illuminate the situation.
Happy New Year!
Of course you are permitted to be cynical Martin! I just wish some of the journalist data analyst would start asking for these numbers, but they are probably too busy analysing what they’ve got to see other parts of the world where the info is so much better.
Thanks for your excellent perspective Jennifer and wishing you a successful 2022.
Thanks, all the best for 2022, and thanks for all your comments here.
Happy New Year, Jennifer. I can’t point you to any specific source, and you would probably know a whole lot better than me – but then didn’t seem to allow for it in your assumptions – I’ve seen that an Omicron hospital stay is materially shorter than a Delta hospital stay. Maybe your UK-based discharge rate makes some allowance, but, if this point is valid, then hospital stress becomes materially less.
Hi Alex, Happy New Year. I haven’t seen a hospitalisation duration source, but South Africa does suggest that hospitalisation itself is milder (less oxygen etc) which would suggest a shorter stay. But if that’s currently true, it also implies much higher daily admissions (since I’ve backsolved from total in hospital), so the number in hospital in the next two weeks doesn’t actually change that much. Hopefully implies a shorter peak in hospital for whenever that occurs though.
Jennifer yes Happy New Year.
NSW has a tiger by the tail now. And from your numbers the Omicron peak looks a really good time to not get sick.
And Vic maybe 10 days behind.
Thank you for clear minded data and analysis, a rarity.