
When is the current Omicron wave likely to peak around Australia? Plausibly the NSW peak is about now (the middle of January) with other states following in the next week or three.
I’ve been using current growth rates to do a very simple exponential projection of cases for the next two weeks here but the growth is so fast that in two weeks time my model projects that nearly a quarter of the Australian population will have reported a positive Covid test. And given how difficult it is to get a test (PCR or rapid antigen) in Australia right now, many cases are not being identified (positivity rates of PCR tests have been around 20- 30% across Australia throughout January). At some point, even if the case numbers don’t show it, the vast majority of people will have been infected.
This Omicron wave, Australia is not locking down, and TTIQ (particularly the testing part) has been overwhelmed. So the underlying dynamics of an infectious disease come into play. When enough of the population has been infected so that each new case has no-one to infect, the wave of infections will peak, and gradually new cases will diminish. The maths behind this was first set out in 1927 as the SIR model – Susceptible – Infected – Recovered. A person in a population is modelled to be in one of those three states, and gradually enough of the population will move to the recovered state so that there aren’t enough people for newly infectious cases to infect to keep the spread going.
This SIR model is the source of the herd immunity measures we’ve heard so much about – the more infectious a disease, the higher the proportion of the population who has to be infected/recovered for the spread to stop.
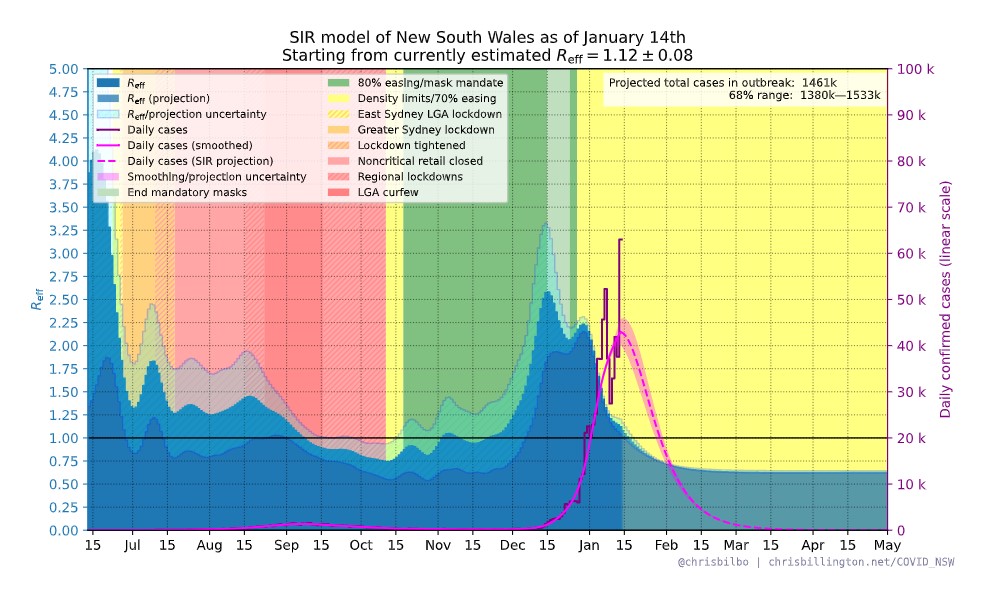
One modeller – Chris Billington – has been publishing an SIR model throughout this outbreak for all Australian states. His prediction for NSW for this wave has consistently been for a peak around the 15th January, on the assumption that only around 20% of cases are identified. This simplest version of the model assumes that everyone is equally likely to infect others once they are infected – they have the same behaviours, and they also have the same level of infectiousness. It also assumes that once infected, you are immune (at least for the duration of the current outbreak).
In practice, of course that isn’t right – someone in their 20s who is going clubbing every night is much more likely to be infected or infectious than someone in their 80s who goes grocery shopping once a week. In practice as a disease spreads through the population, different parts will be fully infected earlier than others – geographically, behaviourally, and by age group. And people will change their behaviours to avoid social contact or reduce its riskiness even without any public health rules. A sophisticated epidemiological model will use simulation and a variety of parameters to track that more closely.
To build those parameters, you have to have an understanding of where we are as a population. And right now, that’s not easy. Here in NSW, we have a test positivity rate of around 30%, which means a huge number of cases are not identified in case numbers. There are many anecdotes of people testing positive on a Rapid Antigen Test (RAT) and then not being able to (and now not required to) confirm with an official PCR test. But are we missing 50% of cases? or 90% of cases? or even more? When will everyone have been infected?
So even those modellers with access to all public health data will find this kind of work difficult, given these challenges. The simple model illustrated here is going to be hard to improve on, given the lack of data. So Chris Billington’s simple projection of a peak in mid January is not unreasonable.
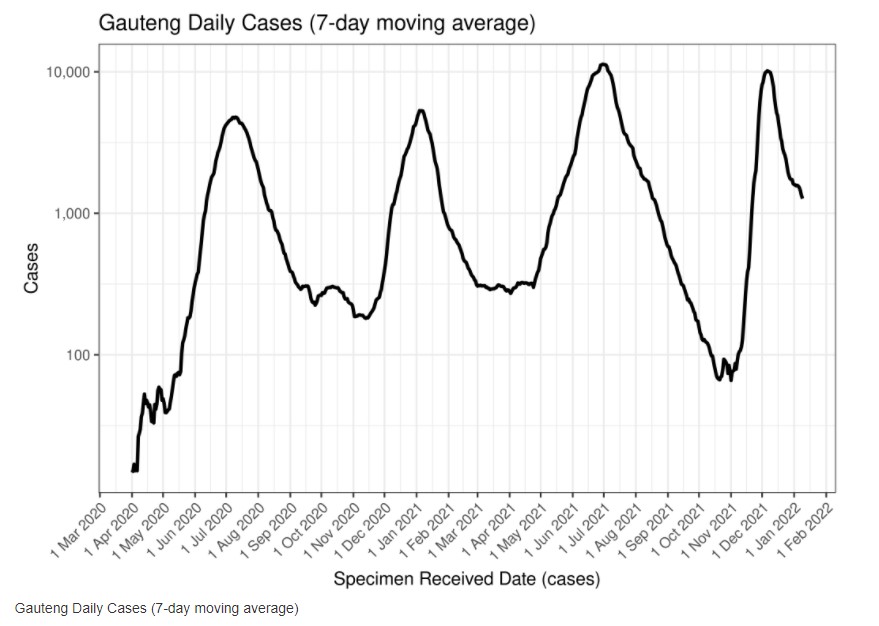
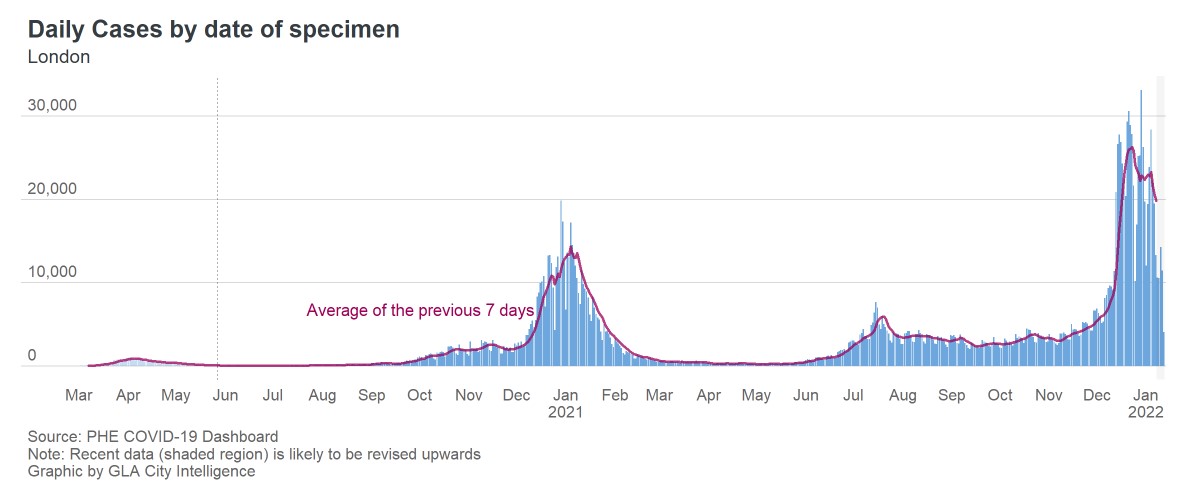
The other way to look at it is by looking around the world at different outbreaks. Australia (particularly NSW) was one of the earlier countries to get an Omicron wave, but so far only South Africa and London show any signs of peaking. How long did their outbreaks last? In South Africa, the wave in Gauteng (the first province, which includes Johannesburg) peaked on 6 December, around 5 weeks after cases starting shooting up, with new hospital admissions peaking on 12 December (Source: Louis Rossouw). In London, cases appear to have peaked towards the end of December (that first 7 day peak in London was the 21st of December, but then there is a plateau), after starting to really increase 5-6 weeks before.
In NSW, the growth rate really started increasing some time in the first week in December, so 5-6 weeks after that is about now – the middle of January. We had a different population to both London and South Africa – more vaccination (but not as many boosters as London), but much less previous infection – which probably means on balance there are more people available to be infected in Australia.
Using either of these approximate methods, it is plausible that the underlying case numbers in NSW, are close to their highest level, with other parts of Australia following behind.
Using both South Africa and London as guides, the pressure on the hospital system won’t peak for another week or two at the earliest, with new admissions peaking nearly a week after new cases, and total patients in hospital generally peaking up to a week after that. The ICU peak is generally even later, with sadly, deaths following after that.
Links
This article talks about what we can expect as Covid evolves – sadly it is not inevitable that it will become milder:
“It’s a fallacy that viruses or pathogens become milder. If a virus can continue to be transmitted and cause lots of disease, it will,” said Prof David Robertson, head of viral genomics and bioinformatics at the University of Glasgow’s Centre for Virus Research.
Viruses aim to create as many copies of themselves and spread as widely as possible. Although it is not always in their best interests to kill their hosts, so long as they are transmitted before this happens, it doesn’t matter.
Neither is it clear that Sars-CoV-2 is becoming progressively milder. Omicron appears to be less severe than the Alpha or Delta variants – but both of these variants caused more severe illness than the original Wuhan strain.
This study from Canada tries to answer the question of whether Omicron is milder by looking at matched cases of Omicron and Delta – this is important because there are so many factors (especially age and vaccination status) which massively affect severity, so you have to be sure you are looking at similar populations to understand severity. And this study does strongly support a milder outcome for Omicron.
For Omicron cases compared to Delta cases, the risk of hospitalization or death was 65% lower (hazard ratio, HR=0.35, 95%CI: 0.26-0.46), while risk of ICU admission or death was 83% lower (HR=0.17, 95%CI: 0.08, 0.37).
Due to the increased transmissibility of Omicron, the absolute number of hospitalizations and impact on the healthcare system could still be significant, despite the probable reduction in severity.
One America, an Indiana based life insurer in the US, has looked at its own mortality experience in working age people.
Davison said the increase in deaths represents “huge, huge numbers,” and that’s it’s not elderly people who are dying, but “primarily working-age people 18 to 64” who are the employees of companies that have group life insurance plans through OneAmerica.
“And what we saw just in third quarter, we’re seeing it continue into fourth quarter, is that death rates are up 40% over what they were pre-pandemic,” he said.
“What the data is showing to us is that the deaths that are being reported as COVID deaths greatly understate the actual death losses among working-age people from the pandemic. It may not all be COVID on their death certificate, but deaths are up just huge, huge numbers.”
He said at the same time, the company is seeing an “uptick” in disability claims, saying at first it was short-term disability claims, and now the increase is in long-term disability claims.
And this study from NSW looks at the severity of Covid19 in children in the NSW Delta outbreak. The study takes advantage of the excellent identification of the vast majority of Covid cases in NSW, with comprehensive monitoring of them having been provided by the NSW Health system.
Twenty one percent of children infected with SARS-CoV-2 were asymptomatic. For every 100 SARS-CoV-2 infections in children <16 years, 1.26 (95% CI 1.06 to 1.46) required hospital admission for medical care; while 2.46 (95% CI 2.18 to 2.73) required admission for social reasons only. Risk factors for hospitalisation for medical care included age <6 months, a history of prematurity, age 12 to <16 years, and a history of medical comorbidities (aOR 7.23 [95% CI 2.92 to 19.4]). Of 17,474 infections, 15 children (median age 12.8years) required ICU admission; and 294 children required hospital admission due to social or welfare reasons.
Our findings are consistent with the international evidence that a large proportion of children infected with SARS-CoV-2 are asymptomatic, and that those who do become symptomatic are likely to have a mild clinical illness, with rhinorrhoea the most common clinical feature.
We did not find evidence that COVID-19 in children due to the Delta VOC is more severe than other variants, which concurs with other published studies.
Hopefully the authors will be able to update the study after time to look at Long Covid in children.
Life glimpses
In Australia, most public health restrictions have been reduced or removed, with the exception of mask wearing. So that puts the onus on each of us to decide what we are willing to do from the menu of possibilities – going to the gym, the theatre, a restaurant or a bar (and many places in between), and how much contact we know or suspect we might have had with a confirmed case. Our comfort levels depend both on our personal risk appetite (how worried are we about being infected) and how much obligation we feel to others who are more at risk (if we reduce the spread we reduce their chance of getting infected, and also reduce the pressure on the whole health care system). I’ve found that’s made it harder to decide what to do, with a number of different groups I’m part of having to negotiate what they are comfortable with based on both types of risk. Back in 2020, I wrote a post about how much harder it is to work out what to do in the absence of rules, and it still seems relevant.
On balance, I’m in favour of a little bit less guidance, and a few more rules – in particular, if a government is strongly recommending a course of action (such as wearing masks on public transport) I think it would be simpler if they made it mandatory. That doesn’t mean I support punitive fines, or draconian police arrests of those breaking the rules. We are a fairly law abiding society, and the strong (my prediction would be 90%+) compliance we would get with a rule as opposed to guidance would probably be enough.
I would not have expected to be in this position if you’d ask me before this all started.
For me, I went to the theatre with some friends last week. We had dinner at a restaurant outside, and then were fully masked (we’ve upgraded from cloth to surgical or P45) the whole time we were inside. We weren’t surprised to get a ping on our contact tracing app that someone else inside the theatre had tested positive. So far, none of us appear to have caught it. But this time around, I know so many people who have tested positive – unsurprising with up to 1 in 10 people in parts of Sydney having tested positive in the last two weeks.
Bit of beauty
This flower was one of the many beautiful flowers we saw at a beach south of Sydney, where we spent the first week of January with friends.

As of today, there have been more Covid deaths in NSW under Dominic Perrottet over his few months as Premier than over the much longer pandemic period Gladys Berejiklian was Premier. And clearly, at around 20 deaths a day over the last few days, the final tally will be way higher. Coming out of lockdown was never going to be easy, but it’s hard to avoid the conclusion that this was poorly prepared for, poorly handled and the dynamics of the Omicron variant poorly allowed for.
Thank you Jennifer. Your posts are always very interesting and timely. I do hope we have reached our peak in NSW.
Thanks, Jennifer. Great to see a well considered attempt at projecting the caseload with such uncertain data. It must be very frustrating for the NSW Health Dept to plan for increasing hospitalisations when the quality of the data is inversely proportional to the number being admitted to hospital with Covid.