
What does “living with Covid” mean in Australia in 2022? There is continued pressure on the hospital and health care system, with illness creating disruption in most workplaces. It is likely that life expectancy has reduced by 6 – 12 months.
In Australia, 2022 has seen most Covid related restrictions reduced or eliminated. Currently, around Australia, masks and vaccination are only compulsory in a small number of high risk settings, only confirmed Covid cases need to isolate (close contacts can go out to low risk settings providing they test negative on a rapid antigen test). A total of 84% of the population has been fully vaccinated (even though the under 5s can’t yet be vaccinated) and just over 50% have had a booster.
- We appear to be settling in to 40,000 – 50,000 cases a day across Australia, fluctuating by the month around that level
- Our hospital and health care system needs an extra 5% capacity to provide the same level care as pre Covid – equivalent to around 6 new major hospitals
- Mortality is likely to be 5-10% higher this year than it would have been without Covid, which is similar to reducing overall life expectancy by 6-12 months compared with before Covid
- Absenteeism due to illness is worse than a bad flu season – around 60% higher than the previous long term average around Australia
- Around 60,000 people are likely to end up with Long Covid that is serious enough to significantly limit their daily activity.
The impact is definitely substantially worse than a bad flu season, but at the same time it isn’t the catastrophe it would have been without an effective vaccine.
So what should we do about it? My view is that we should continue to look for mitigations that work to limit the spread of Covid19, without having too much of an impact on day to day lives – a vaccination plus strategy. On vaccination, we should make a bigger attempt to vaccinate those who aren’t yet fully vaccinated – the school children in the 5-11 age group are not even 50% vaccinated yet, only two thirds of adults have had their third booster doses. We should be monitoring and improving ventilation and/or air filtration in all public buildings – eg schools, offices, shopping centres. While that will be expensive, the cost of this much illness is quite substantial, even ignoring the human implications. We should continue the cultural change we have started of wearing masks where possible (such as public transport) and staying home when we are sick. Reducing the spread of this disease is worth quite a lot both economically and socially.
Case numbers and rate of growth
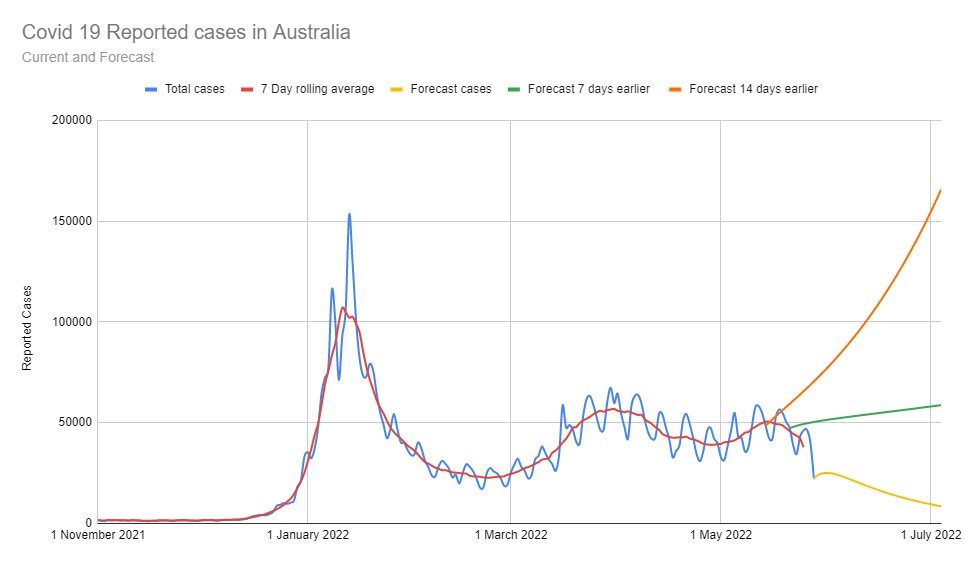
This graph shows the total reported Covid19 case numbers Australia wide over the last six months, and the projection (based purely on current rates of growth and those for the previous two weeks). My mechanical projection is currently forecasting cases to fall, but the last few months experience has been that the curve is hovering around 40,000 – 50,000 cases per day as it has done since February, and plausibly that will continue. Around Australia, total cases reported amount to date are just under 30% of the population. It is increasingly likely that cases aren’t being reported, as people have to pay for their own tests, and the symptoms in many people become more like a cold.
Increasingly people are being infected a second and third time, as the various variants of Omicron evolve to become more able to evade the immune system. Covid19 has continued to surprise us, but it seems likely to me that we will continue to fluctuate around the current number of cases – around 40,000 – 50,000 new cases every day across Australia, meaning around 1.5%-2% of the population is infected with Covid19 at any time.
So if we assume that the current situation is likely to continue indefinitely (a fairly big assumption, but we’ve got to start somewhere!), what does “Living with Covid” look like? What is the new normal?
Mortality and hence life expectancy
In the first year of the pandemic, mortality rates for reported cases were quite variable (in general older people have higher mortality rates, so the second wave in Victoria had high mortality rates (above 2.5% of cases died, and at times well over 5%) which reflected the predominance of cases in aged care there. In contrast, in the most recent twelve months, since Australians have been close to fully vaccinated, and Omicron has spread to those with vaccination protection, the case fatality rate here in Australia has dropped significantly, for Australia as a whole hovering at just under 0.1% of cases.
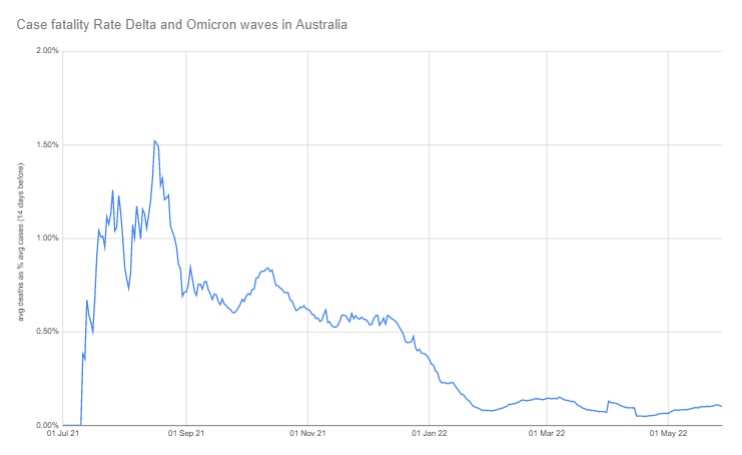
A case fatality rate of under 0.1% sounds quite benign. But overall so far in 2022 just over 6,000 people have died in Australia from Covid19, which is substantially higher than the just over 2,000 deaths for the whole of 2020 and 2021. With so much illness in the community, 0.1% is still quite a lot of people. If we continue to have 40,000 – 50,000 cases per day for the rest of the year, we would expect 40 to 50 Covid19 deaths per day to continue, leading to an overall number of Covid deaths of around 14,000 for a year, of which (say) 12,500 would be caused by Covid (“from” Covid) rather than caused by something else (“with” Covid). That would be an increase in overall mortality of around 8%. More generally, an increase in mortality of 5-10% would reduce overall life expectancy by 6 months to a year. While the mortality increase from Covid is not uniform across age groups, with older people being affected more, life expectancy is still reduced for all, as Covid mortality can still occur in young and healthy people.
Hospital system
I’ve been tracking the usage of Intensive Care beds around Australia since November, when the Delta wave was finally reducing in NSW and Victoria, and the states were talking about opening up. I’ve chosen intensive care as a measure, rather than general hospital usage, because it seems less likely to be influenced by triaging choices given the severity of a need for a ICU bed. This graph shows that over the last six months, at any stage, at least 5% of all intensive care beds in Australia have been occupied by Covid patients. During January and February, as the Omicron wave burst over NSW and Victoria, then the rest of the country, nearly 20% of intensive care beds were occupied by Covid patients. But now we seem to have settled on a fairly consistent 5% of ICU capacity being taken by Covid patients.
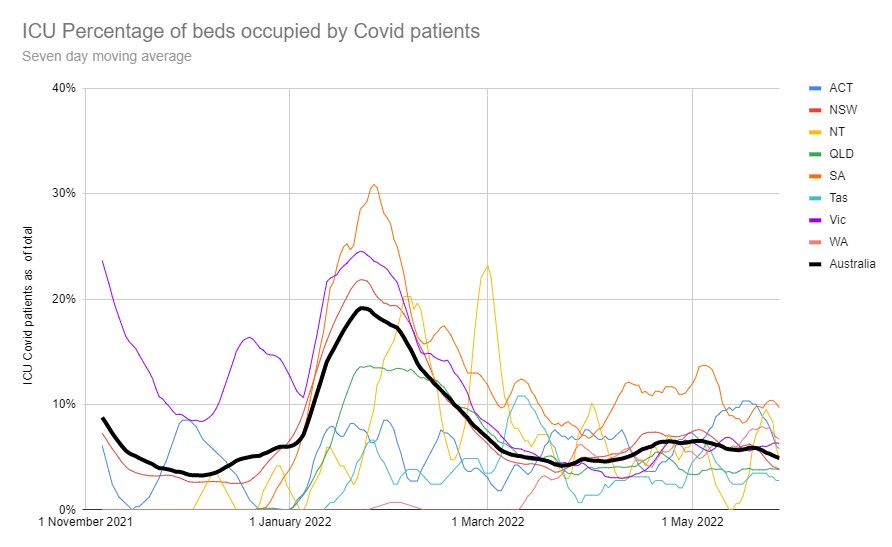
Right now around 5% of all general hospital beds are also occupied by Covid patients. If this continues indefinitely, our hospital system will need to expand by 5% to enable us to receive the same level of health care we received pre Covid. Another way of thinking of this capacity requirement is to look at the number of beds. There are around 2,700 hospital beds, including around 100 Intensive care beds currently occupied by a Covid patient across Australia. A recent hospital built near me is the Northern Beaches hospital, with 488 beds. If this extra Covid pressure on the health system continues, we will need 5-6 new major hospitals around Australia.
Absenteeism
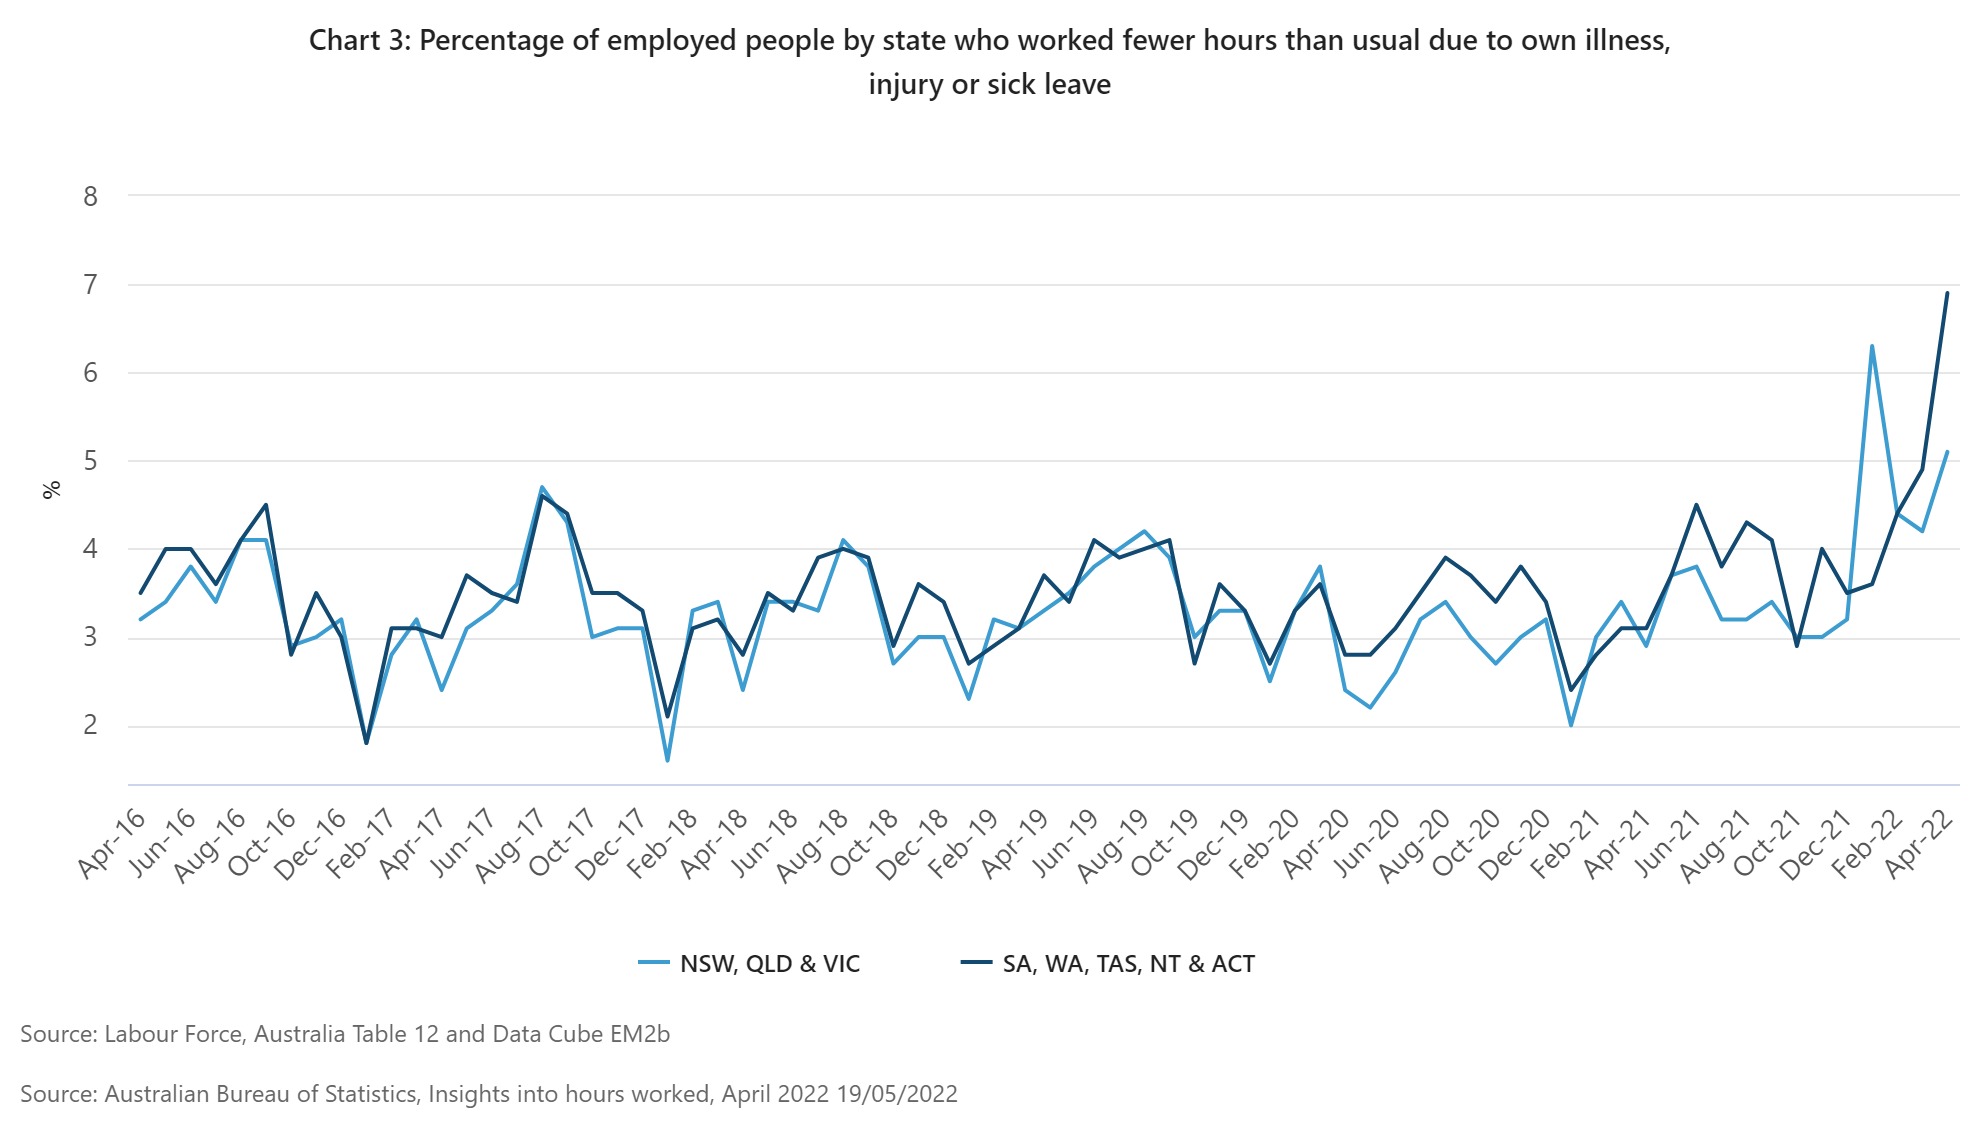
This graph shows that since December, workforce absenteeism (defined as employed people who worked fewer hours than usual due to illness) in Australia has been well above the long term average. Around 5% of the workforce was working less than normal each of the first four months of 2022. That level of absenteeism was higher than the 2017 flu season (which was the worst in the last five years). The long term average is around 3.5%, and during an average Jan- April, absenteeism is generally below 3%. If that percentage continues, then all workforces will need to design work to allow for a sicker workforce ongoing, with a reduced level of reliance on particular individuals. Employers will need to consider how to either increase the size of their workforces, or design jobs for enhanced productivity. Anecdotally I would suggest that a Covid related absence is also generally a bit longer than a non Covid absence. Even in white collar jobs that can be done remotely, the level and duration of illness that stops people working from Covid is generally greater than most seasonal colds and flu.
Another way of looking at sick leave is the flutracker, which has been tracking flu symptoms for many years now. It has around 60,000 people (including me!) filling in a weekly quick survey of their symptoms, and any Covid or flu tests. The people tracked by the survey are not representative of the population, as it was originally started from health workers, and then added other interested people which means it is likely to have people who are more conscientious than average about their health, but possibly also more exposed to disease. But the participants are largely the same week to week, which means it is a good comparison of annual trends. Currently in May 2022, the percentage of participants who have fever, cough, and absence from daily duties is higher than the worst part of an average flu season.
![]()
Long term disability
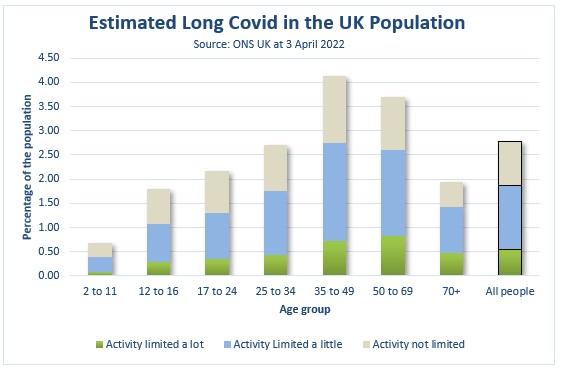
Long Covid continues to be very hard to grasp, statistically, as the symptoms and effects are so widely varied. The best measure I have seen of the effect on day to day life continues to come from the UK, with the latest survey showing 0.5% of the total population (346,000 people in the UK) with day to day activity limited a lot by Long Covid symptoms more than 4 weeks after an infection. The most affected age group is the 35-69 year age group. This number is likely to go up as people continue to be infected.
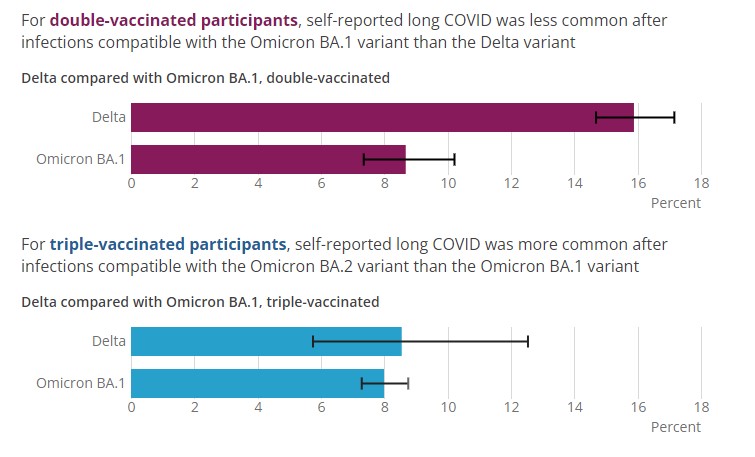
There is some good news for Australians, the UK has analysed the chance of Long Covid after triple vaccination and/or infection with Omicron, and it is around half the chance of Long Covid from a Delta infection and/or after double vaccination only. Most Australians have been infected after vaccination, and with Omicron, so for Australians in general, the chance of Long Covid is materially less than the UK. Even 0.25% of the population left with a serious disability is a lot of people, however. In Australia that would be around 60,000 people, even with current levels of infection, more as people continue to be infected.
What is our new normal?
To summarise the different aspects of “living with Covid”:
- We appear to be settling in to 40,000 – 50,000 cases a day across Australia, fluctuating around that level on a monthly basis
- With that number of cases, our hospital and health care system needs an extra 5% capacity to provide the same level care as pre Covid – equivalent to around 6 new major hospitals
- Mortality is likely to be 5-10% higher this year than it would have been without Covid, which is similar to reducing overall life expectancy by 6-12 months compared with before Covid
- Absenteeism due to illness is and will probably continue to be worse than a bad flu season – around 60% higher than the previous long term average around Australia
- Around 60,000 people are likely to end up with Long Covid that is serious enough to significantly limit their daily activity.
The impact is definitely substantially worse than a bad flu season, but at the same time it isn’t the catastrophe it would have been without an effective vaccine.
So what should we do about it? My view is that we should continue to look for mitigations that work to limit the spread of Covid19, without having too much of an impact on day to day lives – a vaccination plus strategy. On vaccination, we should make a bigger attempt to vaccinate those who aren’t yet fully vaccinated – the school children in the 5-11 age group are not even 50% vaccinated yet, only two thirds of adults have had their third booster doses. We should be monitoring and improving ventilation and/or air filtration in all public buildings – eg schools, offices, shopping centres. While that will be expensive, the cost of this much illness is quite substantial, even ignoring the human implications. We should continue the cultural change we have started of wearing masks where possible (such as public transport) and staying home when we are sick. Reducing the spread of this disease is worth quite a lot both economically and socially.
Links
An economist makes the case for investing in clean air – an article from Peter Martin in the Conversation:
A new six-nation study of office workers in countries from China to the United States found that where ventilation is poor and levels of particulate matter are high, workers perform worse or more slowly on tests involving adding and subtracting and colour-coding words.
Another study on the relationship between indoor air quality and competitive chess players found that when the concentration of fine particulate matter with a diameter smaller than 2.5 micrometres (0.0025mm, better known as PM2.5) climbs as much as it can, players are 26% more likely to make mistakes…. a program designed to contain the spread of COVID that left Australia with schools and workplaces in which the occupants were able to think clearly, and rarely caught infections – that would deliver an enduring dividend.
The cost of poor indoor air can be measured not just in billions, but in billions per year. Back in the late 1990s the CSIRO calculated a cost of $12 billion per year. Two decades on, coronaviruses and bushfire smoke would make it greater still. We’ve been offered a cost-effective chance to make the invisible visible and extend our productivity and lifespans. I reckon we should grab it.
And a German study using wearables suggests that vaccination has a measurable impact on the long term impacts of Covid10 infections, up to and including Long Covid:
Vaccines are among the most powerful tools used to combat the COVID-19 pandemic. They are highly effective against infection and substantially reduce the risk of severe disease, hospitalization, ICU admission, and death. However, their potential for attenuating long-term effects of a SARS-CoV-2 infection, commonly denoted as Long COVID, remains elusive and is still subject of debate. Such long-term effects can be effectively monitored at the individual level by analyzing physiological data collected by consumer-grade wearable sensors. Here, we investigate changes in resting heart rate, daily physical activity, and sleep duration in response to a SARS-CoV-2 infection stratified by vaccination status. Data was collected over a period of two years in the context of the German Corona Data Donation Project with currently around 190,000 monthly active donors. Compared to their unvaccinated counterparts, we find that vaccinated individuals on average experience smaller changes in their vital data that also return to normal levels more quickly. Likewise, extreme changes in vitals during the acute phase of the disease occur less frequently in vaccinated individuals. Our results solidify evidence that vaccines can mitigate long-term detrimental effects of SARS-CoV-2 infections both in terms of duration and magnitude. Furthermore, they demonstrate the value of large scale, high-resolution wearable sensor data in public health research.
Life glimpses
As restrictions have been removed, my work and home life has also been getting back to a new normal. I’ve been to Melbourne a few times this year, including for a conference with 300 other people. In an outcome that surprised no-one, the day after the conference all attendees received an email to let them know that a number of attendees had come down with Covid19 and were almost certainly infectious during the conference. Luckily I wasn’t one of them.
In general, many of my work interactions have been somewhat disrupted by Covid – people I work with having Covid and working from home when they are well enough, I’ve had a week of isolation when someone in the household was sick, and mid week closure of restaurants and cafes near by as they run out of staff to manage their business.
While an in person meeting is always better, everything else being equal, I am encouraged by how much the zoom/ virtual meeting trend is continuing when it makes sense. Its good for the planet, and I certainly don’t miss those early morning starts to get a flight somewhere.
Some of my New Zealand relatives are visiting this week, a trip they had planned for this time in 2020, as Vivid is back on in Sydney. I suspect it will be even more crowded than usual as everyone makes up for the two years they’ve missed.
Bit of beauty
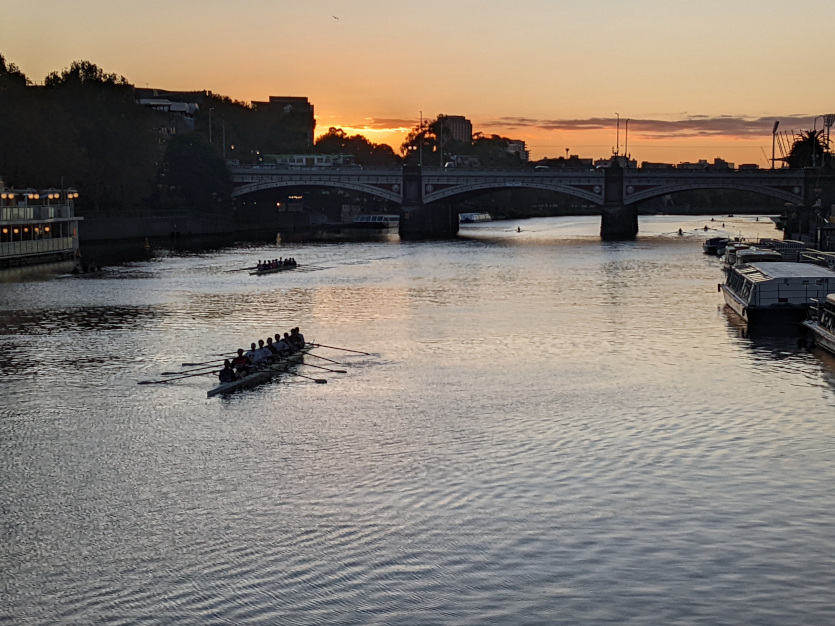
Today’s bit of beauty comes from Melbourne, a peaceful dawn scene during one of my recent trips there.
JL
A puzzling paper from National Institutes of Health; Pharma Chemist Derek Lowe sets the context:
https://www.science.org/content/blog-post/search-long-covid
See in particular comment appended beneath by Christopher Verlinde on the difference between diseases & syndromes.
ps I had Chronic Fatigue Syndrome; subsequently it has been determined to be an auto immune disorder. I wouldn’t be surprised if some % of ‘Long Covid’ cases were as well.
Missed your post. Agree with
your approach. So glad you woke up
To take this beautiful dawn scene.
Love
Relevant to the topic, and developed by Australian virologist Ian M. Mackay:
https://virologydownunder.com/the-swiss-cheese-infographic-that-went-viral/
Voila Version 4.3:
https://twitter.com/MackayIM/status/1434033705312415747
Thank you for this. It is most helpful. I am particularly interested in the effects of Covid on smokers, and ex-smokers. There seems to be little data in Australia. And I am concerned that eligibility criteria for anti- virals in Australia is very restricted, and does not include smokers and ex-smokers as it does in the USA. Use of anti-virals in the early stages of the disease could reduce hospitalisations, and possibly long-Covid – especially if we can identify more vulnerable groups. For example I have noticed peri-menopausal women (forties) seem vulnerable – just anecdotal. There are many people who could benefit from anti-virals.