
Today the IPCC released its sixth assessment report, and I’ve had a look at what it says about extremes – weather and climate. In this land of drought and flooding rain, extreme weather is already damaging, and the IPCC report makes it clear that it is going to get worse – the extremes get more extreme faster than the medians move. I’ve talked about why that is and about extreme weather and the link to climate change previously here.
The report is thousands of pages of expert analysis. If you read one thing, read the summary for policymakers, where there are 40 or so pages of very clear information about the current position, and five future scenarios.
The most optimistic scenario, labelled SSP1-1.9 (the numbers are the temperature range above the 19th century), can only occur if world’s carbon emissions get to net zero by 2050, and then more carbon is quickly sucked out of the atmosphere. That’s the scenario that most countries (and the states of Australia) say they are aiming for now. But unfortunately, the actions the world is taking don’t yet match that scenario as emissions keep increasing. The most pessimistic scenario, labelled SSP5-8.5, (again this implies an eventual temperature range of 5 to 8 degrees Celsius above the 19th century) assumes that carbon emissions keep increasing from now, doubling by 2050. There are lots of implications of those temperature numbers.
So what did the panel of experts at the IPCC have to say about extreme weather? What happens in the next 20-50 years? They said
Projected changes in extremes are larger in frequency and intensity with every additional increment of global warming
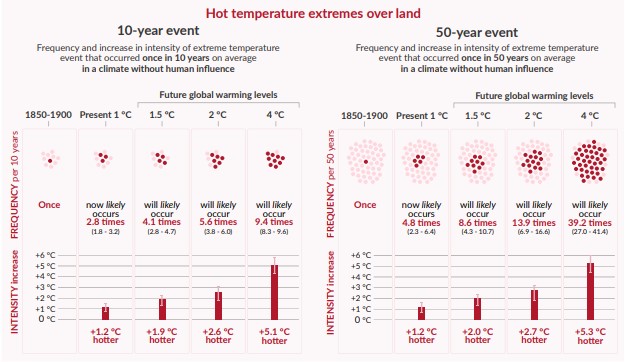
This graph from their summary report shows the impact of each extra amount of warming on heat extremes. The way to read this graph is to look at the shaded dots. At the present level of climate change (1 degree of warming since the 19th century) an extreme 1 in 50 year heat event now occurs 4.8 times as often – so once every 10 years. To illustrate the concept, in central Sydney, back in the 19th century a day more than 40 degrees Celsius would happen once every 10 years. Last summer we had 2 days above 40 degrees Celsius.
At global warming levels of 1.5 degrees Celsius (which the reports says we cannot avoid, and is likely to occur by 2040 at the latest), an extreme 1 in 50 year heat event would occur 8.6 times as often – so just under once every six years. And at global warming levels of 4 degrees Celsius (which will occur this century under the two extreme scenarios), an extreme 1 in 50 year event would occur 39 times every 50 years – in other words that extreme heat would become normal.
Extreme heat matters to population health. In 2003, an extreme heat wave hitting Europe caused around 70,000 extra deaths. This analysis from the UK looks at 2020 where around 2,000 excess (non Covid) deaths occurred during heatwaves in the 2020 summer. More recently, actuaries looking at the latest Covid death statistics in the UK have concluded that the recent heatwave there is probably the reason for around 500 – 700 excess deaths (above the 400 Covid19 deaths) in the last week of July.
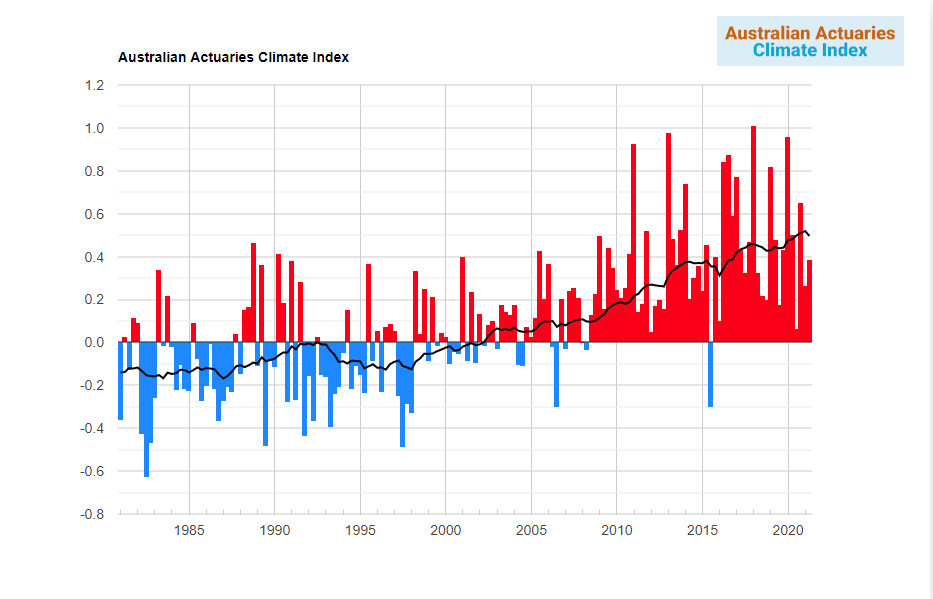 The Australian Actuaries Climate Index shows what is happening to extreme weather in Australia up to this year. The index focuses on extremes, looking at an index of the frequency of combination of extremes at the 99th percentile (temperatures, rainfall, wind, drought and sea level).
This graph of the Index shows that extremes of weather are increasing very quickly, and shows a very similar pattern and slope to most climate graphs of temperature you will see.
Links
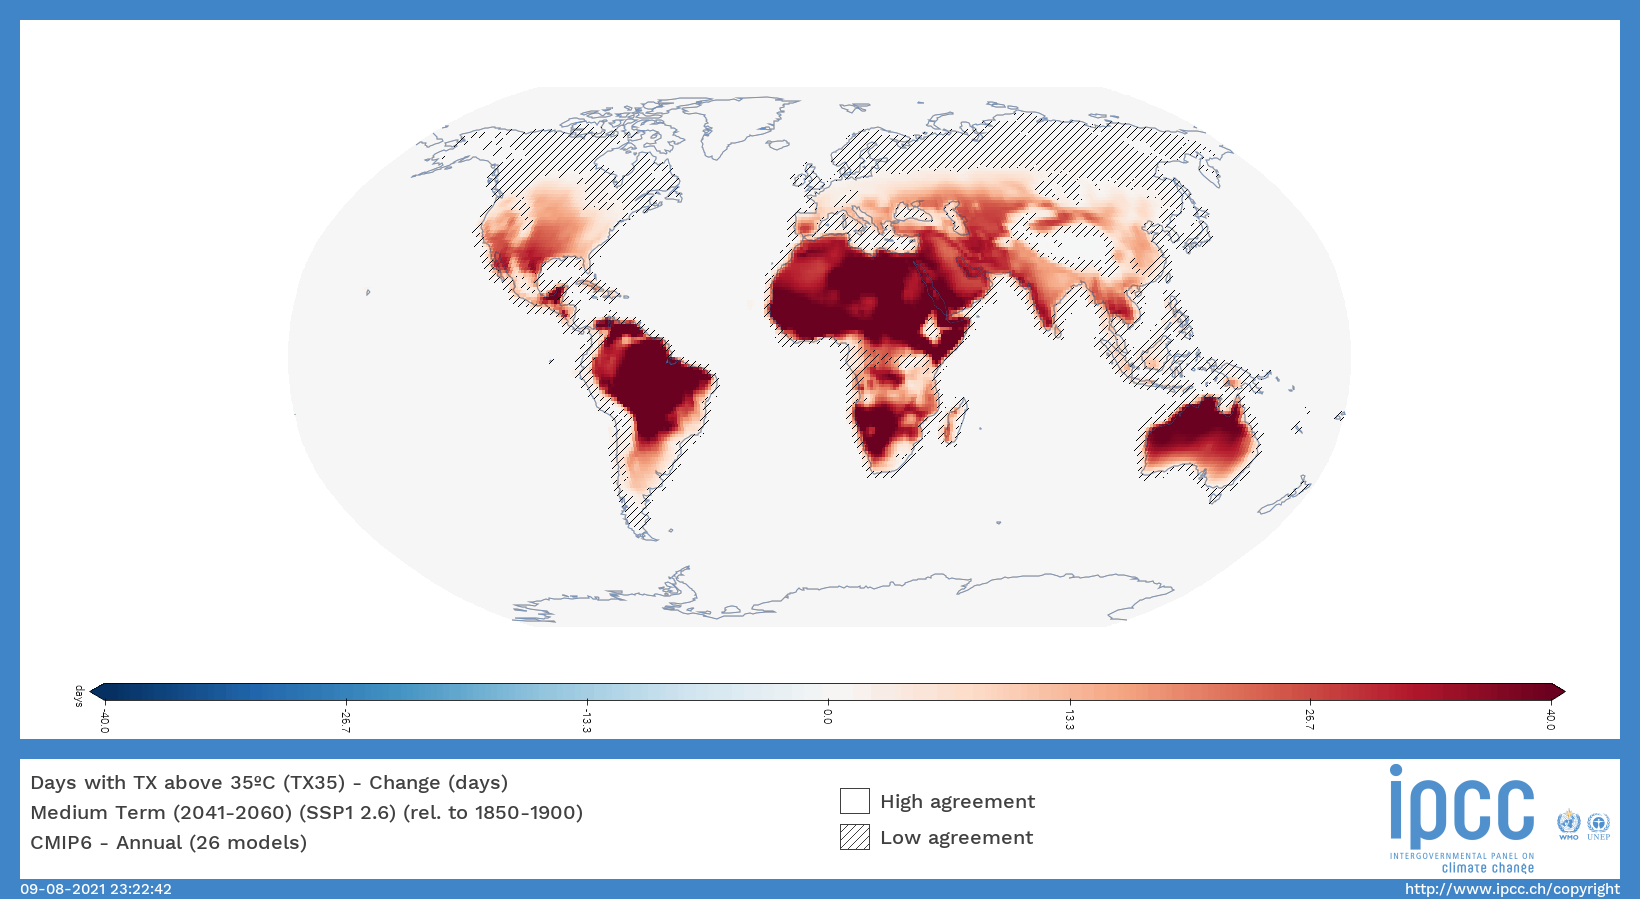
The IPCC also released an interactive atlas, which is sobering, but at the same time a lot of fun to play with. Here is a scenario of the medium term change in days above 35 degrees celsius, using the most optimistic of the climate scenarios available to us.
About
This is the first of a new series of reflections – Climate Reflections – to go with my Covid Reflections. I’d be interested in feedback about what I can cover in future. After writing about Covid for eighteen months, it continues to strike me how many ways in which Climate Risk is a slow moving version of pandemic risk, and so many of the lessons we have learned about how to manage such a major crisis are valuable for climate risk. For example:
- Listening to scientists (If only all those politicians who talk about following the health advice would also talk about following the climate scientist advice)
- Delay is costly – the quicker you take action, the smaller the cost of the crisis and the cost of the action
- Inequality is costly – rich countries, neighbourhoods and people are not able to avoid what happens to other, poorer countries, neighbourhoods and people
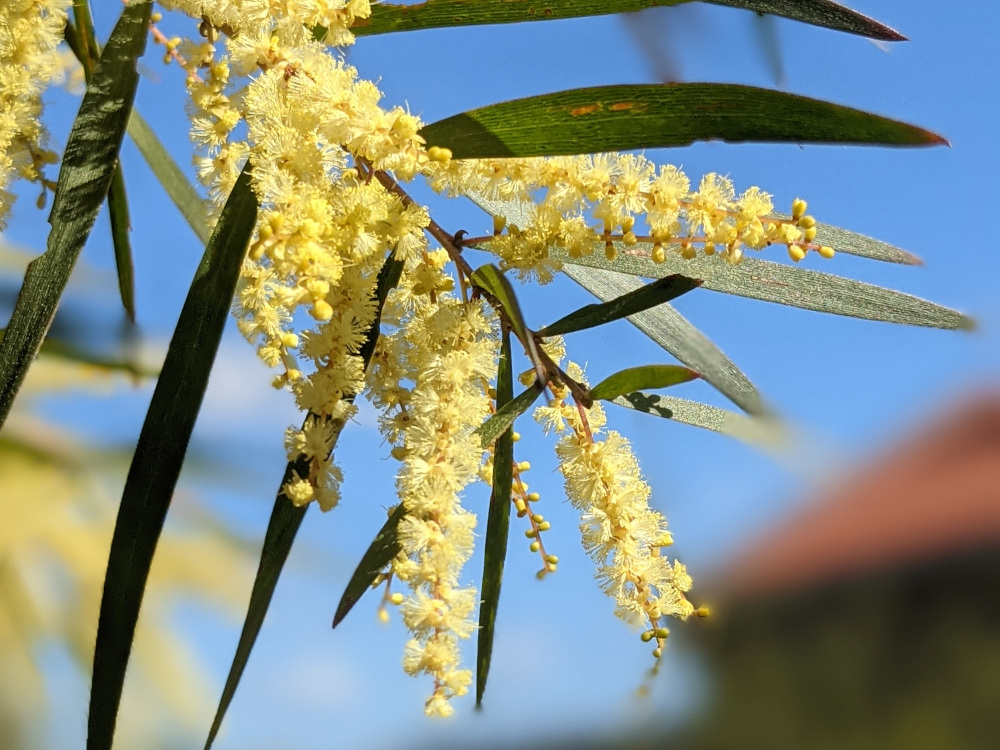
Bit of beauty
As in my other Covid series, I plan to have pictures every time here. Today, with a focus on Australia’s here’s our national flower at its best.
Can you look at East coast Australia sea level rise and frequency of cyclones/ east coast lows?
Thanks, Jennifer,
I think the other two lessons from the pandemic are:
1. The importance of an action plan linked to an articulated strategy
2. The importance of clear and compelling communication
Perhaps a future topic may be examples of either from other countries