
Is the NSW Covid wave peaking? NSW Health reporting suggests it is, but their statistics don’t really report that view.
On Boxing Day here in Sydney, there is another Covid wave, and some people are curious to know if it’s peaked yet. I keep thinking I’ve written my last Covid reflection, but there is always another actuarial angle! This time it is to share an insight from one of my fellow actuaries and Covid analyst, Karen Cutter.
Every week NSW Health puts out a report on respiratory disease in NSW. The latest one is here. And just as they have done since the 12 November report, they report that the number of new hospitalisations has gone down since the previous week, and that therefore the wave is about at its peak. And every week, the numbers seem to be higher than last week. This is what they said this week:
Key indicators for transmission under current settings, including PCR positivity, hospital admissions and admissions from emergency departments are stable or declining. This is consistent with NSW reaching a peak in the previous week. The rate of decline is uncertain and may be slowed due to high levels of social mixing over the holiday period….
…The seven-day rolling average of daily hospital admissions decreased to an average of 119 admissions by the end of this week, compared with 128 admissions at the end of the previous week. There were 834 people with COVID-19 admitted to hospital and 58 people admitted to ICU this week.
But check out the graph of average daily hospital admissions in NSW. Does this look like a peak to you?
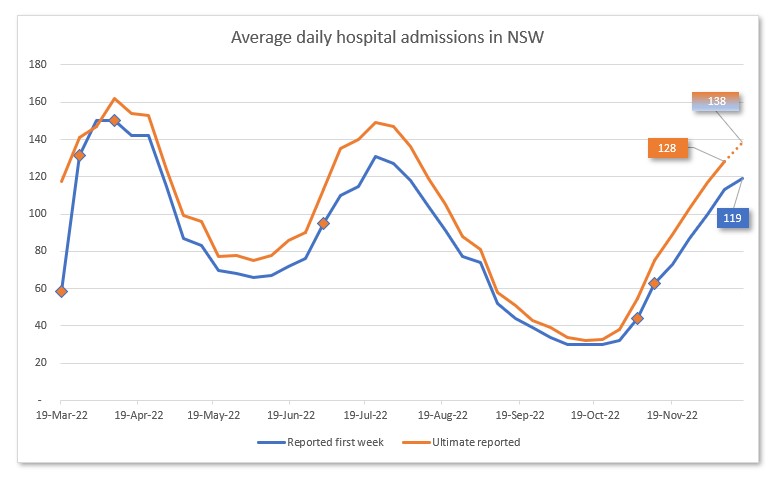
How can this be? It is a reporting problem. The clue is in the fact that there are two lines. I’ve marked up the last known point on each line to illustrate. The number 128 is the average daily hospitalisations in the week ending 10 December, reported as at 17 December. The number 119 is the average daily hospitalisations in the week ending 17 December, also reported as at 17 December.
The two are not comparable. On 10 December, average daily hospitalisations in the week to 10 December were reported as 113. Another 15 hospitalisations were reported late. So if we assume (as I’ve done in the graph) that the same proportion of extra hospitalisations will be reported a week later, this week’s hospitalisations were probably around 138, rather than the reported 119. And sadly, that means hospitalisations are still increasing, albeit at a slightly slower rate than they were a week ago (when the increase was twice as big).
The case numbers this week have actually come down slightly, and the positivity rate of PCR tests is steady, so it is possible that we are reaching the crest of the wave. But given how few people are testing themselves, and then telling NSW Health about a positive test, let alone having a PCR test, hospitalisations are a much better measure of trends than case numbers, particularly at this time of the year. And the number of people in hospital in NSW on 23 December (from Covidlive, which is still going!) was 1,618, the highest it has been so far this wave. The number of Christmas parties I am hearing about and seeing locally suggest there is a lot of opportunity for further spread; a peak in mid January seems a bit more likely to me.
This post is really for the actuaries out there, as it is a new (to me) illustration of the usefulness of the concept of IBNR -Incurred But Not Reported. In any set of statistics like this, understanding what the date in the data actually means is crucial. In actuarial speak, the date that the hospitalisation occurred is the incurred date – and the date that the hospitalisation makes it into NSW Health reporting is the reported date. Every week there are 10-20% “Incurred but not reported” hospitalisations, which must be included if you are comparing this week’s numbers with the total for the previous week. Mixing up the two different types of date is a surefire way to misunderstand the data that is being reported.
Links
Since China removed many restrictions in the face of an overwhelming wave of Omicron and increasing civil unrest, it has been very hard to find good data on how bad their current wave of Covid19 is. This article from the Financial Times uses old fashioned on-the-ground reporting to try and figure it out – and it isn’t good.
Hospitals in Beijing are being overwhelmed by sick elderly Covid-19 patients just weeks after China abandoned its tough coronavirus containment measures with little preparation for the exit wave now ripping through the country. Emergency rooms have run out of portable beds for patients, the infirm are waiting hours for ambulances and many doctors are too sick with Covid to work. Some facilities are so overloaded they are running out of oxygen hookups for those with respiratory problems.
This article from one of my favourite all-around Covid commentators Eric Topol talks about how a country’s different experience with earlier Covid variants (their “immunity wall”) changes how badly the current variant’s impacts are.
There have been marked differences for how the population of different countries respond to the Covid pandemic, perhaps best exemplified in the BA.5 variant wave. … deaths have been higher for BA.5 in Australia and New Zealand than any prior variant, and particularly Omicron BA.1. That’s a distinctly different pattern from South Africa, where there was little evidence of increased fatality for BA.4/5 or the United States where the increase was small. Why are there such striking differences for the effect of BA.5 between countries?
It is important to consider the immunity wall for each population to understand the impact of the virus and its evolutionary arc. The very same variant that is seen as “mild” in one county can be quite “severe” in another. Many factors contribute to the variable perception of the pathogenicity of a specific variant. Keep the immunity wall of a population in mind when you try to interpret the data.
Life Glimpses
Well I finally tested positive to Covid a week and a half ago, catching it from a household contact, my mother. She is old enough to be eligible for antivirals, so annoyingly for me, and luckily for her, she recovered much more quickly than I did. But really, from what I’ve read, my case wasn’t too bad. It was very similar to a bad cold, but with lingering fatigue, and annoyingly for the time of year, less tolerance to alcohol than normal (a symptom I haven’t previously read about). Luckily nobody else in the household caught it from us, so our isolation (in our big house) wasn’t too bad.
Very fortunately, our isolation was finished in time for us all to have a celebratory cocktail with regular actuarialeye commenter Marta, who is visiting Australia from Israel for the first time in three years.
Bit of beauty
Today’s bit of beauty comes from an early morning walk in the park this morning. It was quite a surprise to wake up to so much mist, which burned off about an hour later to turn into a quintessential Sydney summer day.

Hi, thank you for mentioning the
commenter Marta, I am presently
In Victoria, probably as results of
Christmas over eating, I cannot comment sensibly. I know that in Israel there are Covid cases however
nothing is reported in the media.Tacit agreement to keep the covid out of news
Love from rainy Flinders
Hi Jennifer, your post was reassuring in a strange way, as it validated my view that the numbers of COVID cases continue to rise, even while the NSW Chief Health Officer and others have reported that we have reached the peak at various times over the past 3 weeks. The numbers of people in hospital in NSW can be the only true indicator of the numbers of people with COVID now. The numbers of people in hospital with COVID in NSW was reported today as 1,712. While we continue to wear masks and take precautions, the most common way we acquire this virus is from family and friends, it seems, and with everyone getting together over the festive season, I think your estimate that we will reach the peak in mid January is pretty spot-on. Thank you for another interesting post.